
Hello QAVvers
It’s Tuesday again and time for my weekly update.
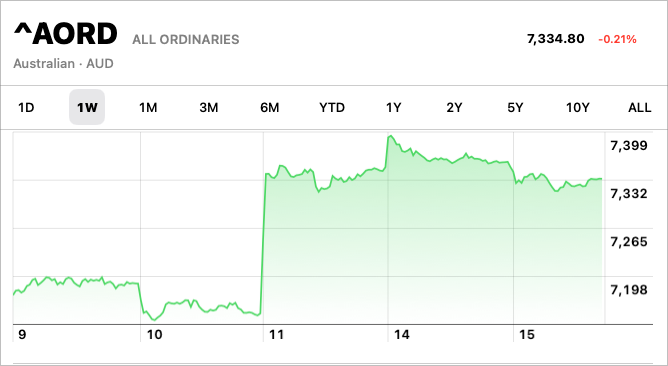
The AORD bounced last Friday, on the strength of better-than-expected USA inflation numbers and, perhaps, the belief that the GOP will control the House and that will be good for the US economy.
Let’s have a look at the portfolio and what we have to buy this week.
QAV PORTFOLIO REPORT
INCEPTION (02/09/2019) REPORT
A strong week on the AORD wasn’t as kind to coal stocks, so our performance saw a small decline in the last week.
UPDATE: 2022-11-15 03:42 pm
Thanks to listener Alex who pointed out that the Navexa chart we usually use doesn’t, in fact, show the STW’s total return, only its capital return! However there *is* a chart where we can see the total return:
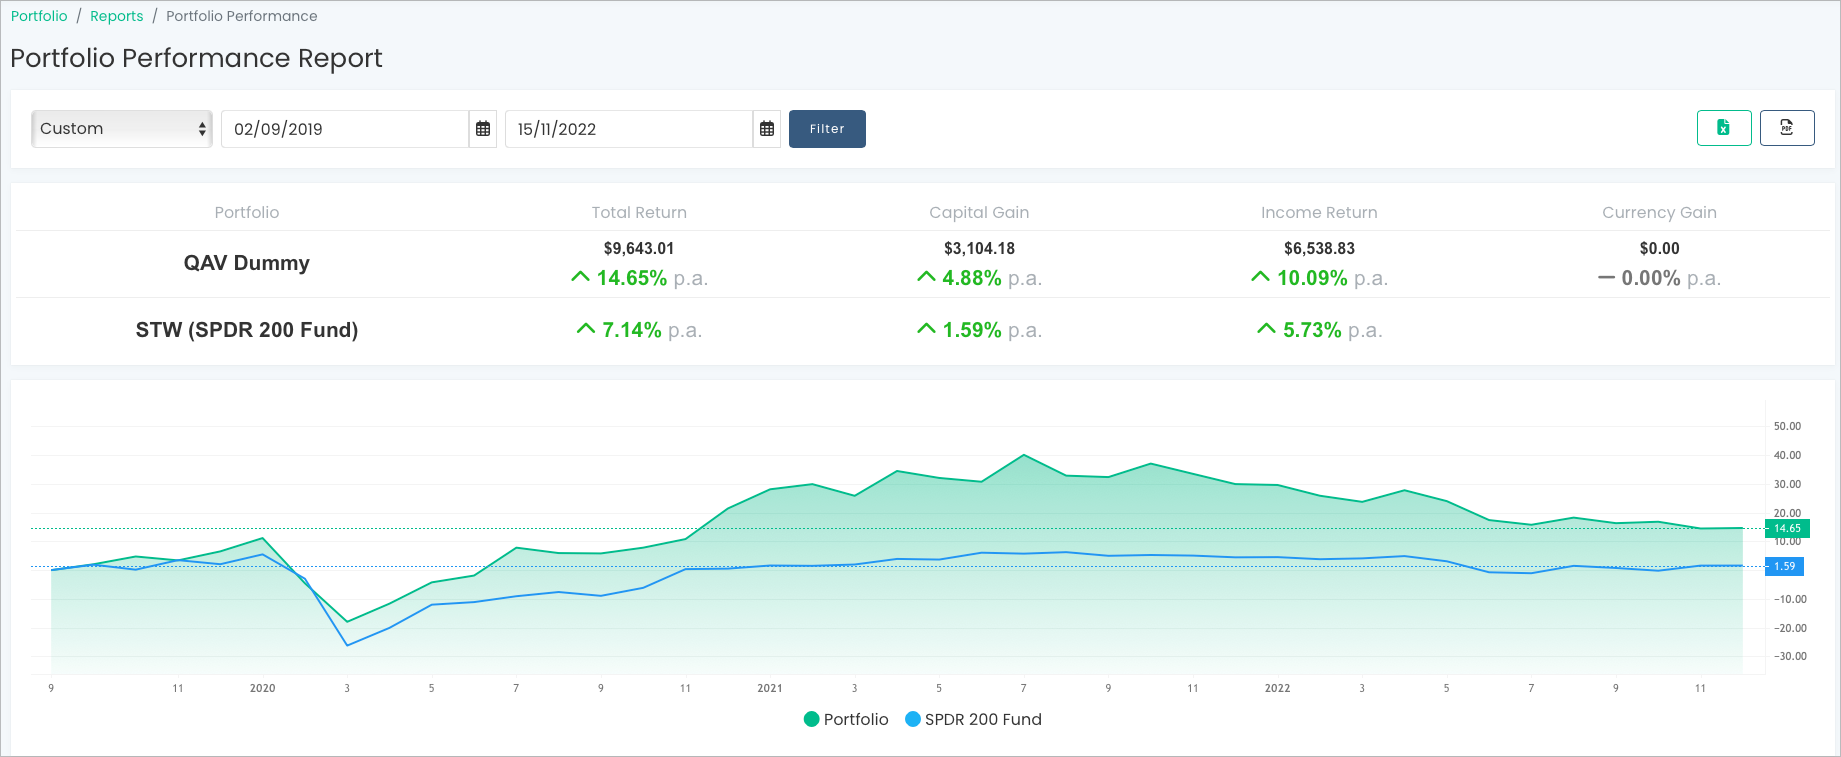
So, we’re UP 14.65% vs the benchmark which is UP about 7.1%. That makes WAY more sense. Thanks again, Alex!
You can always check out the live version of the portfolio chart here (but it shows only the capital return for STW). We’ll talk to Navexa about fixing their main chart.
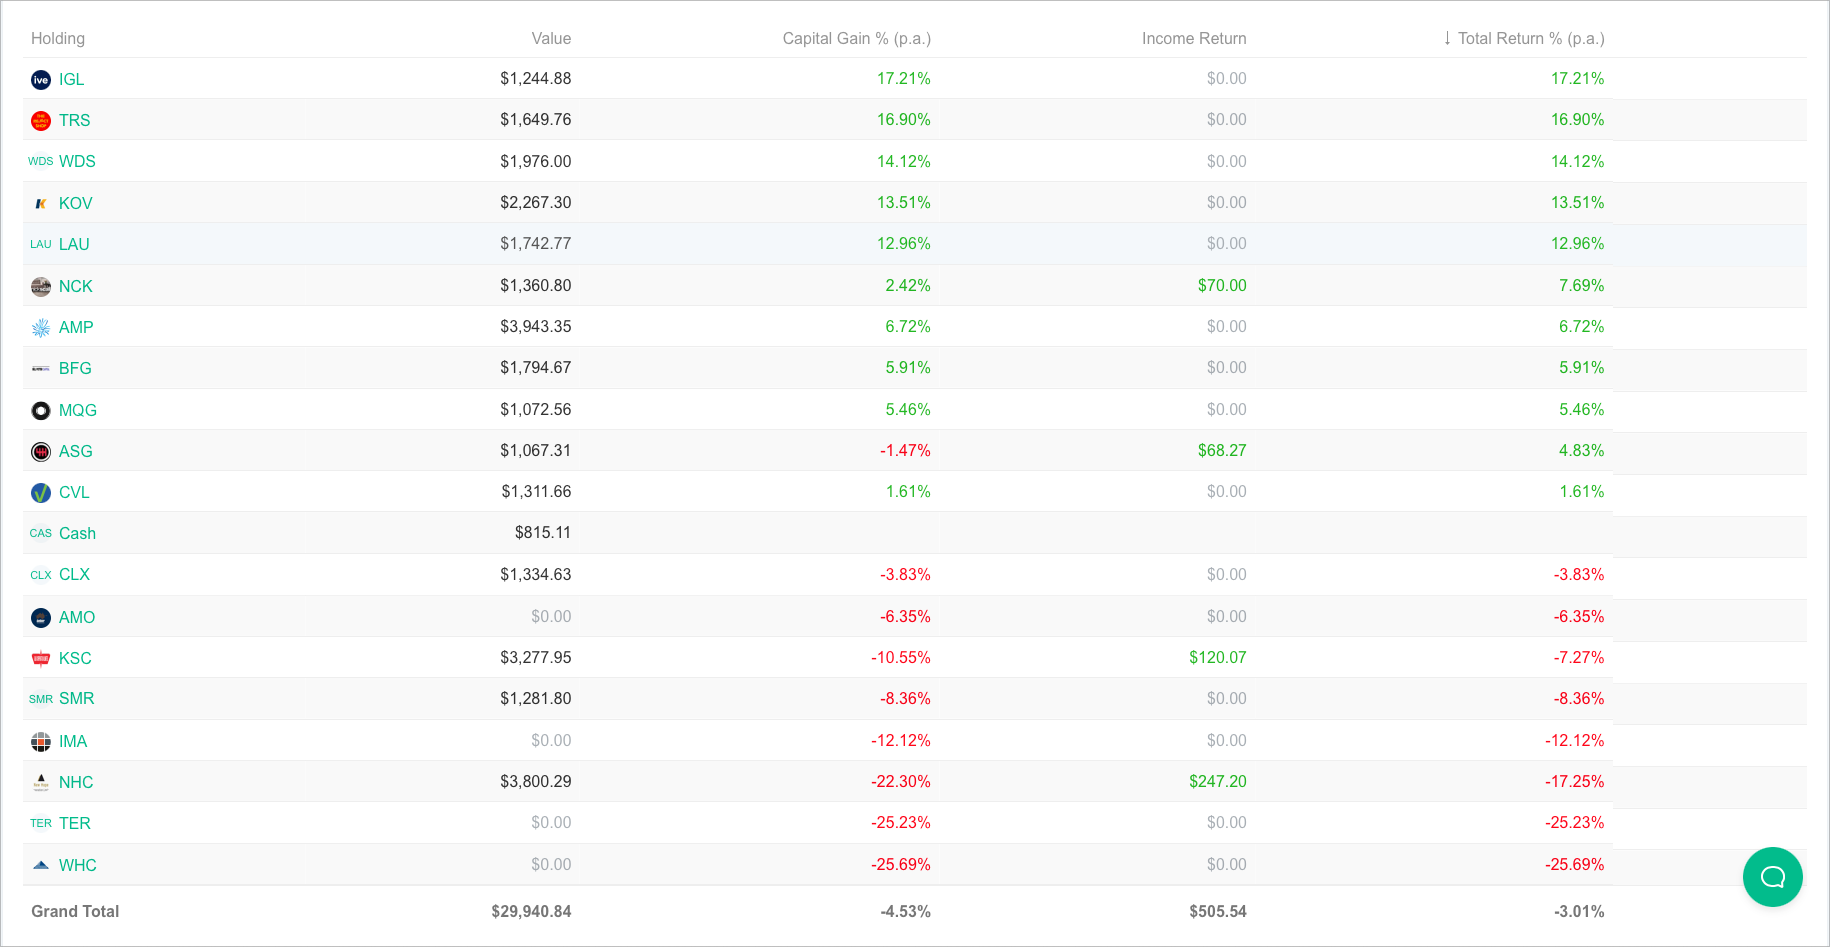
Here are how the stocks have performed in the last 30 days:
RECENT TRADES
In the last week we sold WHC and added BFG.
STOCKS OF THE WEEK
** As always, please check our work, DYOR, and consult a financial advisor before making any investing decisions.
BUY LIST
Each week we produce a buy list that we share with our members.
THIS SECTION CONTAINS CONTENT WHICH IS VISIBLE TO QAV CLUB SUBSCRIBERS ONLY.
QAV 544 — Follow The Recipe
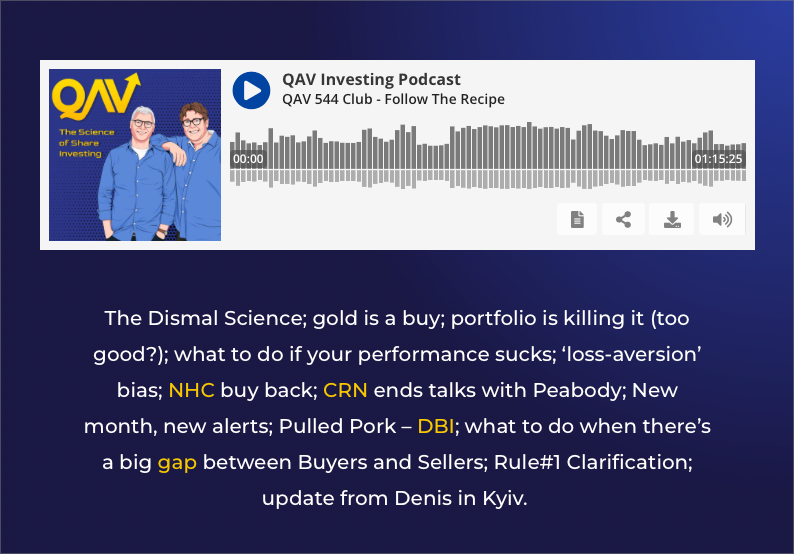
Detailed highlights of the episode:
THIS SECTION CONTAINS CONTENT WHICH IS VISIBLE TO QAV CLUB SUBSCRIBERS ONLY.
DISCLOSURE
In the interest of full disclosure, we would like to advise that as of the date of this email, the QAV team currently hold these stocks:
ALO AMP BPT CGF IGL JHG MQG NAB NHC NWH QAN QBE VEA WAM WDS WHC XTE S32 PRU
If you’re interested in learning more, please review our trading and disclosure policy.

Thanks for the podcast.
In relation to the ongoing confusion about portfolio benchmarking and performance tracking; it seems to me that the graph in Navexa is only tracking the capital return of the index and not the total return. It does this no matter what stock/benchmark you choose.
If you open up the performance menu in Navexa you should be able to see the total return of the chosen benchmark.
For what it’s worth I’d have thought VAS (ASX 300) would be a more appropriate benchmark as the portfolio often has stocks from the smaller cap end of the market.
I have reported the benchmarking display issue to Navexa. Maybe if more people complain we will get a fix faster.
Woah! Thanks, Alex! You’re right. I’ll add that to our notes for next week.