Hi folks,
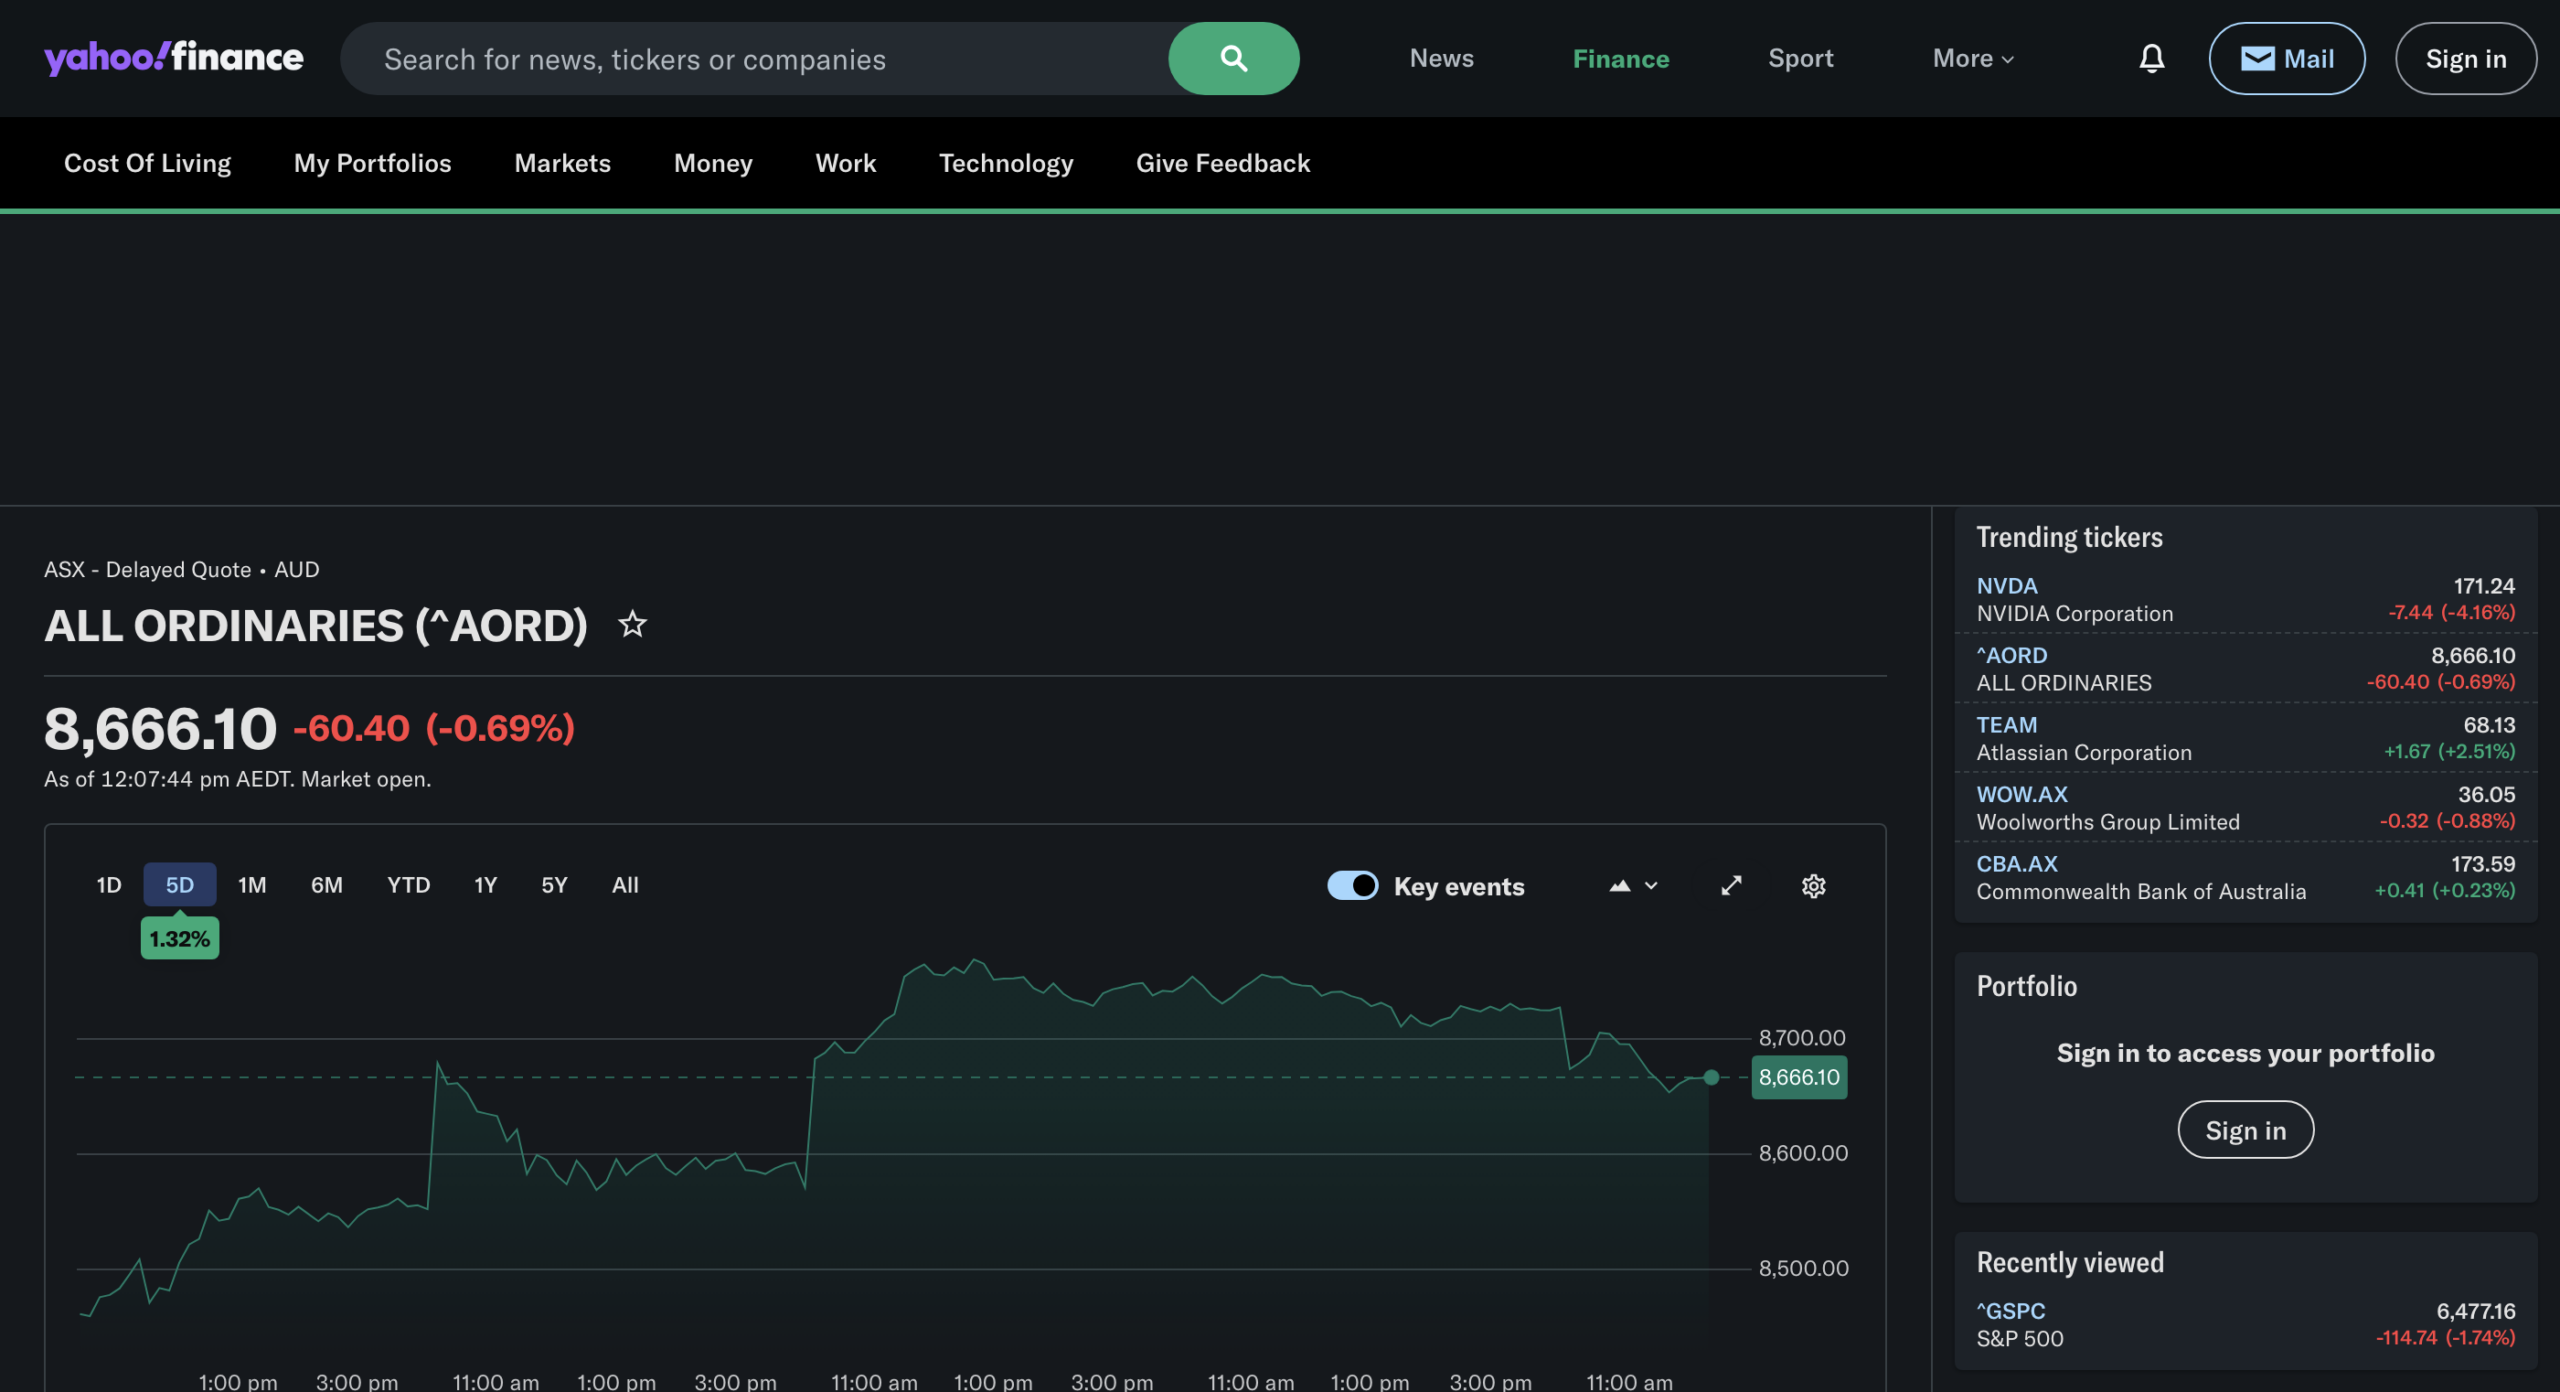
Australian markets delivered a mixed week with the All Ordinaries closing down 0.69% or 60.40 points in the latest session.
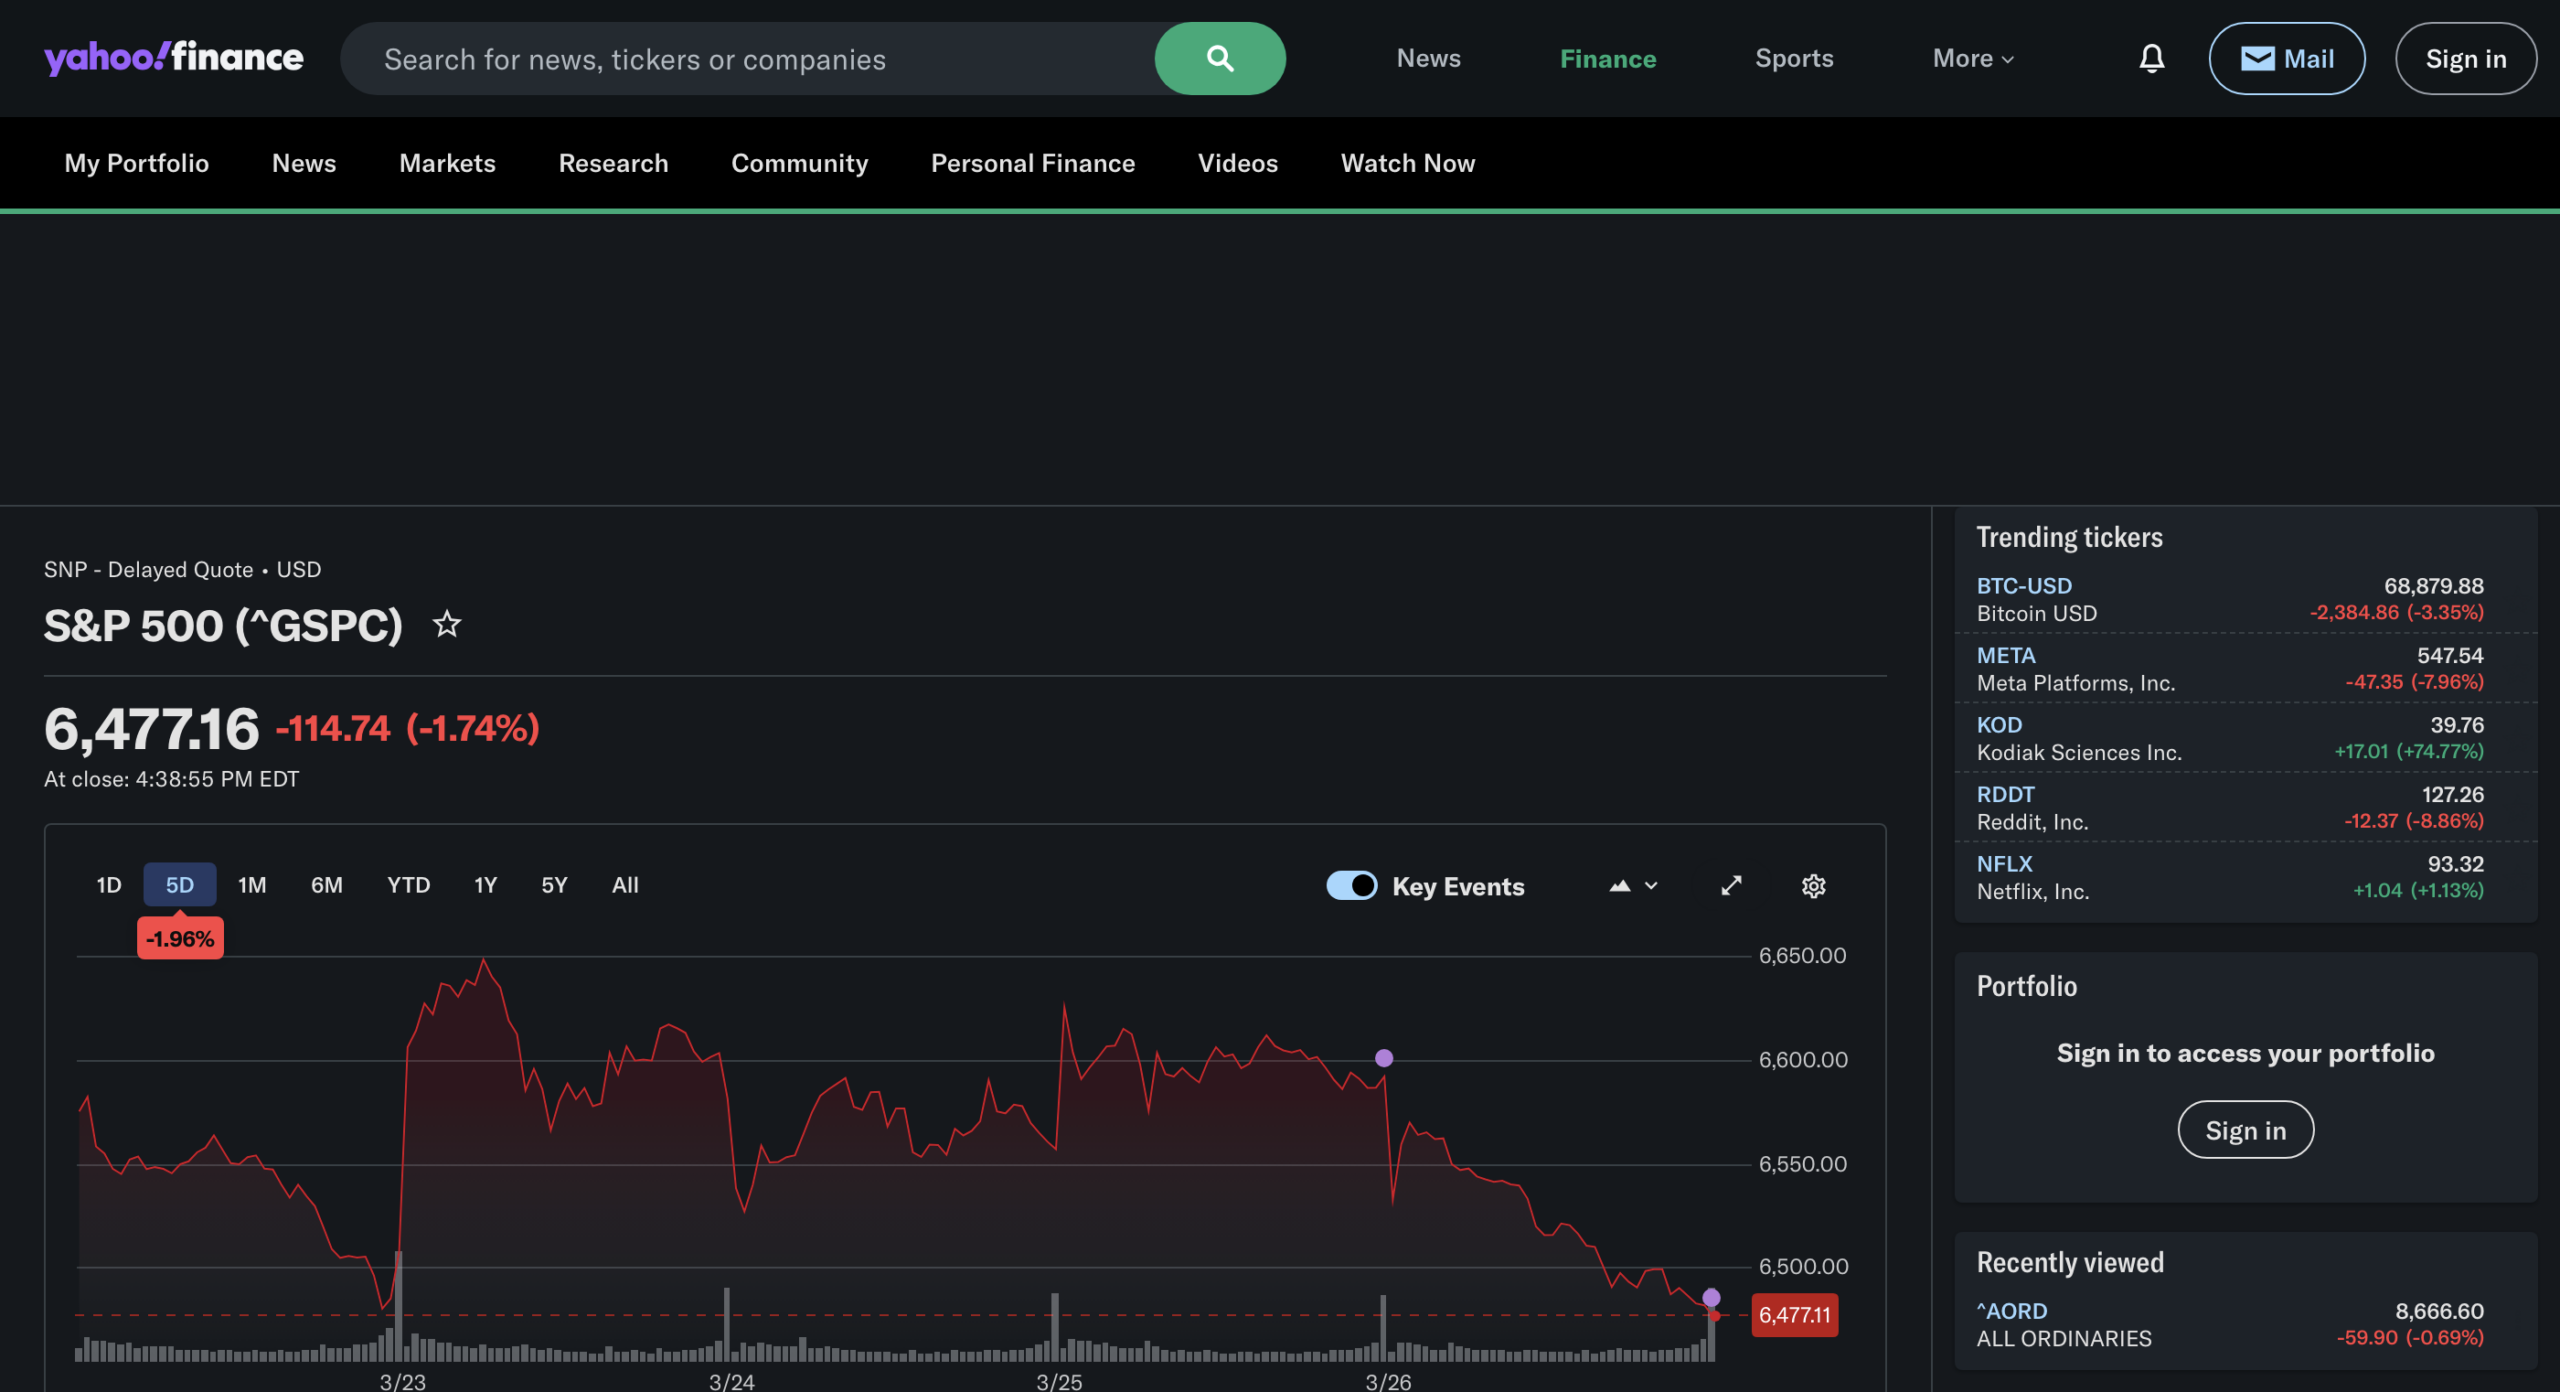
US equity markets suffered their steepest decline since geopolitical tensions escalated, with the S&P 500 dropping 1.74% to close at 6,477.16 on Thursday. The market apparently doesn’t put much stock in Trump’s suggestions that a deal is close at hand. And, even if it is, the damage done to the global economy is going to last for months… or longer.
So, let’s get into my weekly updates and see where we are at.
All the Best,
Cam
QAV MYTH KILLERS
If you’ve ever spent much time reading the Investosphere, you’ll have come across some form of this bon mot of dodgy wisdom: “Index funds always beat active stock picking”.
To whit:
“Why index funds beat stock pickers”
“Why Index Investing Beats Active Stock Picking (Most of the Time)”
Even the GOAT himself says it:
“Why Warren Buffett Says Index Funds Beat Stock Picking for Most Investors”
My mate Steve Sammartino told me the same thing when I first interviewed him back in 2008 about his “Sammartino Method” of investing (which is just buying index funds) long before I had heard the name “Kynaston”.
Warren’s actual quote is “A very low-cost index is going to beat a majority of the amateur-managed money or professionally managed money.”
And he’s correct (of course). But the key words are ‘a majority’.
The way to be in the minority, and to beat an index fund, isn’t hard — it’s called having a system.
Most investors, amateur and professional, don’t stick to a proven investing system.
Let me quote again from WWOWS (the source of last week’s article):
Structured investing is a hybrid of active and passive management that automates buy and sell decisions. If a stock meets the criteria, it’s bought. If not, not. No personal, emotional judgments enter the process. Disciplined implementation of active strategies is the key to performance. Traditional managers usually follow a hit-and-miss approach to investing. Their lack of discipline accounts for their inability to beat simple approaches that never vary from their methods. Don’t second-guess. Don’t change your mind. Don’t reject an individual stock — if it meets the criteria of your strategy — because you think it will do poorly. Don’t try to outsmart.
- What Works On Wall St by James O’Shaughnessy
If you have a disciplined strategy, and you follow it day-in-day-out, you can beat an index fund — and most professional investors.
Let’s look at the numbers.
What does the market actually return over time?
Here are the STW (SPDR S&P/ASX 200 Fund) total return figures, including dividends, net of fees — as of 28 Feb 2026:
- 1 year: 16.20%
- 3 years p.a.: 12.15%
- 5 years p.a.: 10.73%
- 10 years p.a.: 10.64%
→ Source: ssga.com/au — STW fund page
Five-to-ten years is a reasonable timeframe for comparison. So the SPDR200 returns roughly 10–11% a year on average.
Now let’s look at the performance of the funds and we’ll start with active fund managers.
In Australia 74% of active fund managers underperformed the ASX 200 last year, and over 15 years that blows out to 87%.
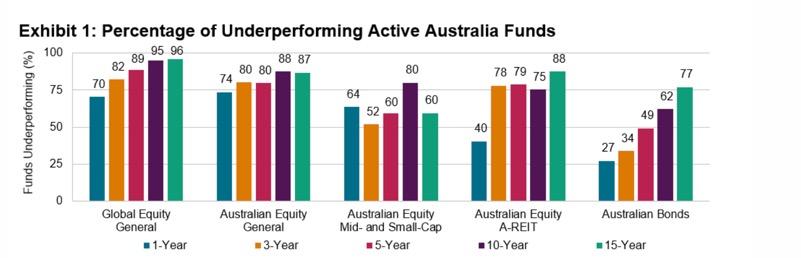
SPIVA Australia (S&P Global, Year-End 2025 — published March 2026)
What a great gig that must be. Get paid a fortune to underperform the index. I bet they all have really impressive business cards.

But what about index funds?
Here are the verified figures as of February 2026:
VAS (Vanguard Australian Shares Index ETF) — after fees, total return
- 1 year: 16.38%
- 3 years p.a.: 12.12%
- 5 years p.a.: 10.62%
- 10 years p.a.: 10.69% → vanguard.com.au (as of 28 Feb 2026)
A200 (BetaShares Australia 200 ETF) — after fees
- 1 year: 16.46%
- 3 years p.a.: 12.28%
- 5 years p.a.: 10.97% → betashares.com.au (as of 27 Feb 2026)
Over 5–10 years the return 10–11%, the same as the SPDR200 (which is what you’d expect).
On the other hand.…
And we do this part-time. I’ve probably spent less than an hour a week managing the QAV portfolio in the last year. During the last 12 months, in this portfolio, I’ve only done 21 trades (10 sells, 11 buys). That’s an average of less than one trade per month. Despite all of the chaos and volatility, I’ve had to trade less than once a month.
Beating the system isn’t hard if you have a system. It takes a system to beat the system.
STOCK ANALYSIS OF THE WEEK
Despite the chaos in the markets, I’ve found a few things to buy this week and you can see my Light posts here.
I also added something to the U.S. Light portfolio this week. U.S. Light and Club members can read about it here.
On the full Australian podcast this week, Tony did a deep dive on KAR. See the podcast link down below if you want to listen to his analysis.
On the American episode, I did a deep dive on KODK. See the podcast link down below if you want to listen to my analysis.
BUY LIST
Each week, we produce a buy list based on our value investing system that we share with our QAV Club members. The intended primary purpose of this buy list is for club members to use as a reference for comparing their own buy list. In theory, all of our buy lists should look pretty similar each week.
QAV Value Investing Buy List (AU) 2026-03-22
Below is a link to the US list for this week (available to our U.S. Club members):
QAV Value Investing Buy List 2026-03-23
PORTFOLIOS
We compare our performance to what we think is the most relevant benchmark (SPDR 200 in Australia, S&P500 in the USA), but if you’re new to investing, these comparisons might not mean much. Instead, you can compare our performance to the top-performing Super Funds in Australia and see why an amateur active investor (who has a system to follow) can out-perform most of the “professionals”.
AUSTRALIAN
QAV DUMMY
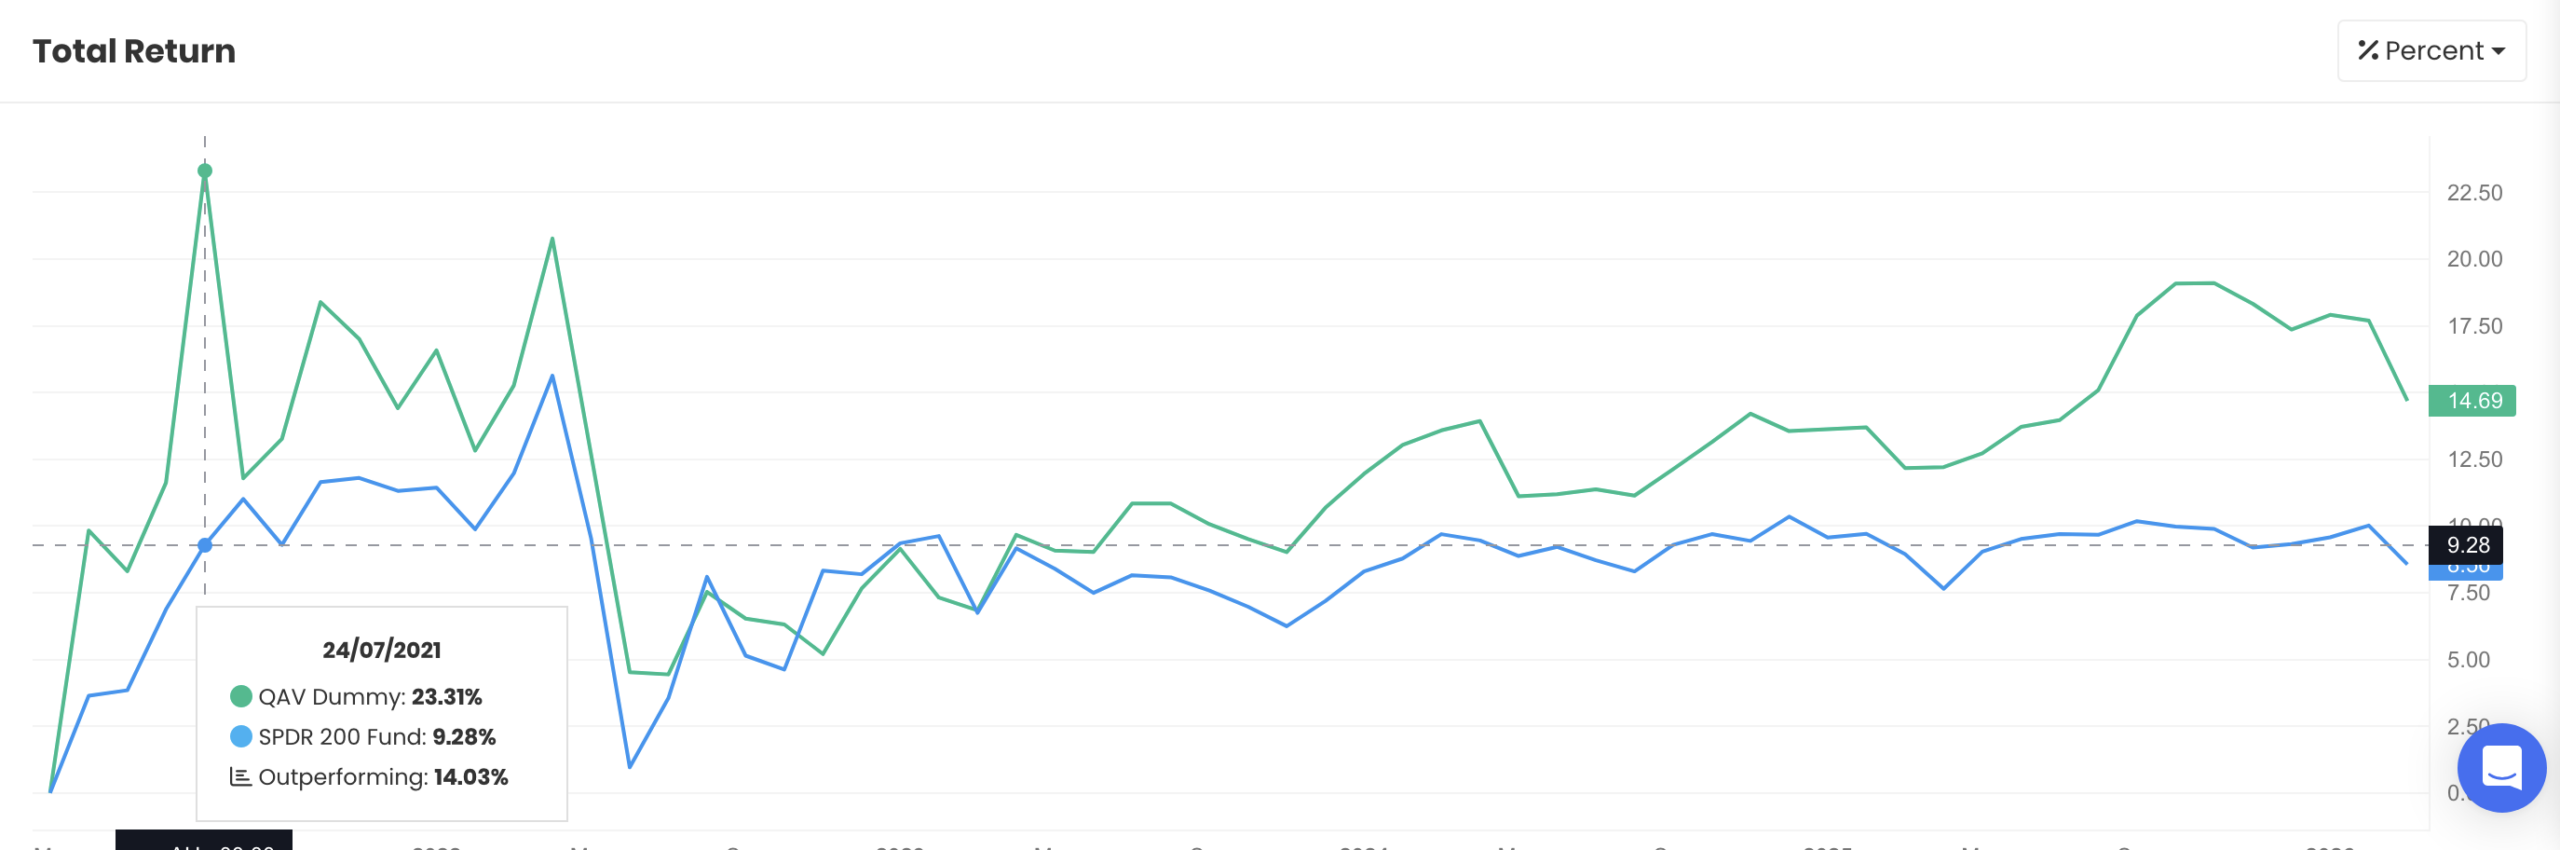
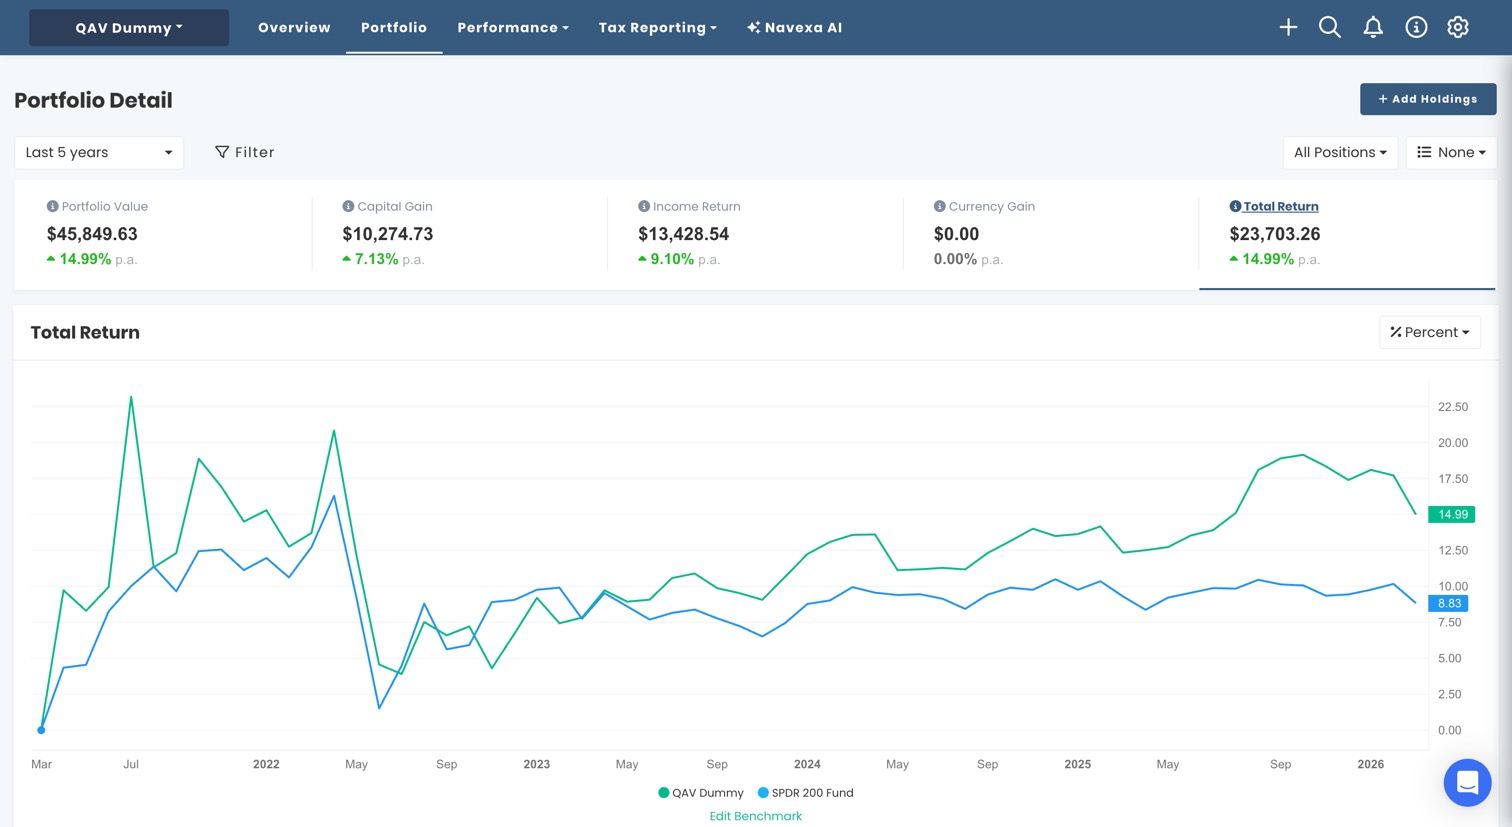
Five Year Report: Over the past five years, the QAV portfolio has delivered approximately 14.7% total returns compared to the ASX 200’s 9.3%, representing an outperformance of roughly 5.4 percentage points. The QAV strategy has consistently tracked above the benchmark for most of the period, particularly from mid-2022 onwards where the performance gap widened significantly. Both portfolios experienced similar volatility patterns, but QAV’s superior stock selection has translated into meaningfully higher returns for investors.
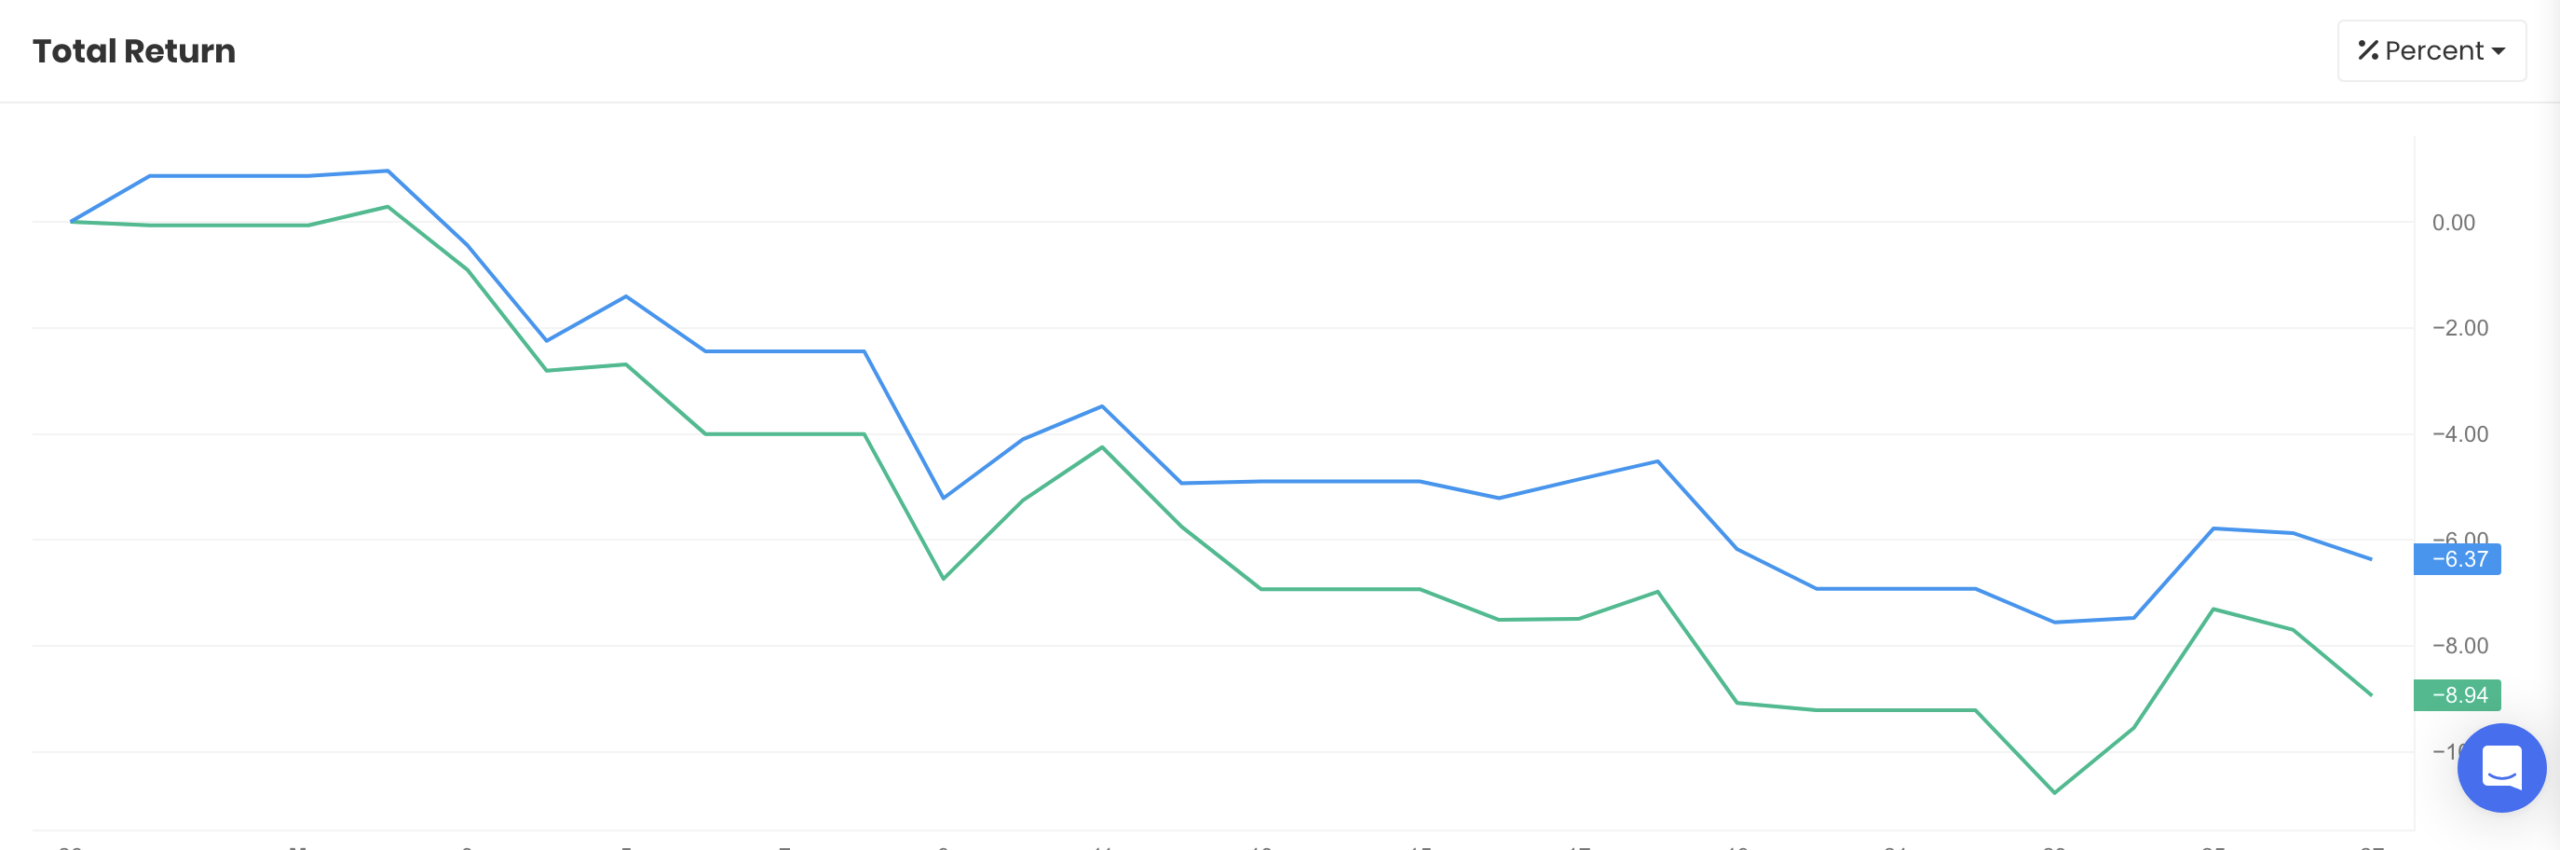
Monthly Report: Over the past 30 days, the QAV portfolio declined approximately 9.7% while the ASX 200 fell 6.37%. Both the portfolio and benchmark experienced significant declines, with the QAV showing greater volatility throughout the month.
No changes to our portfolio this week.
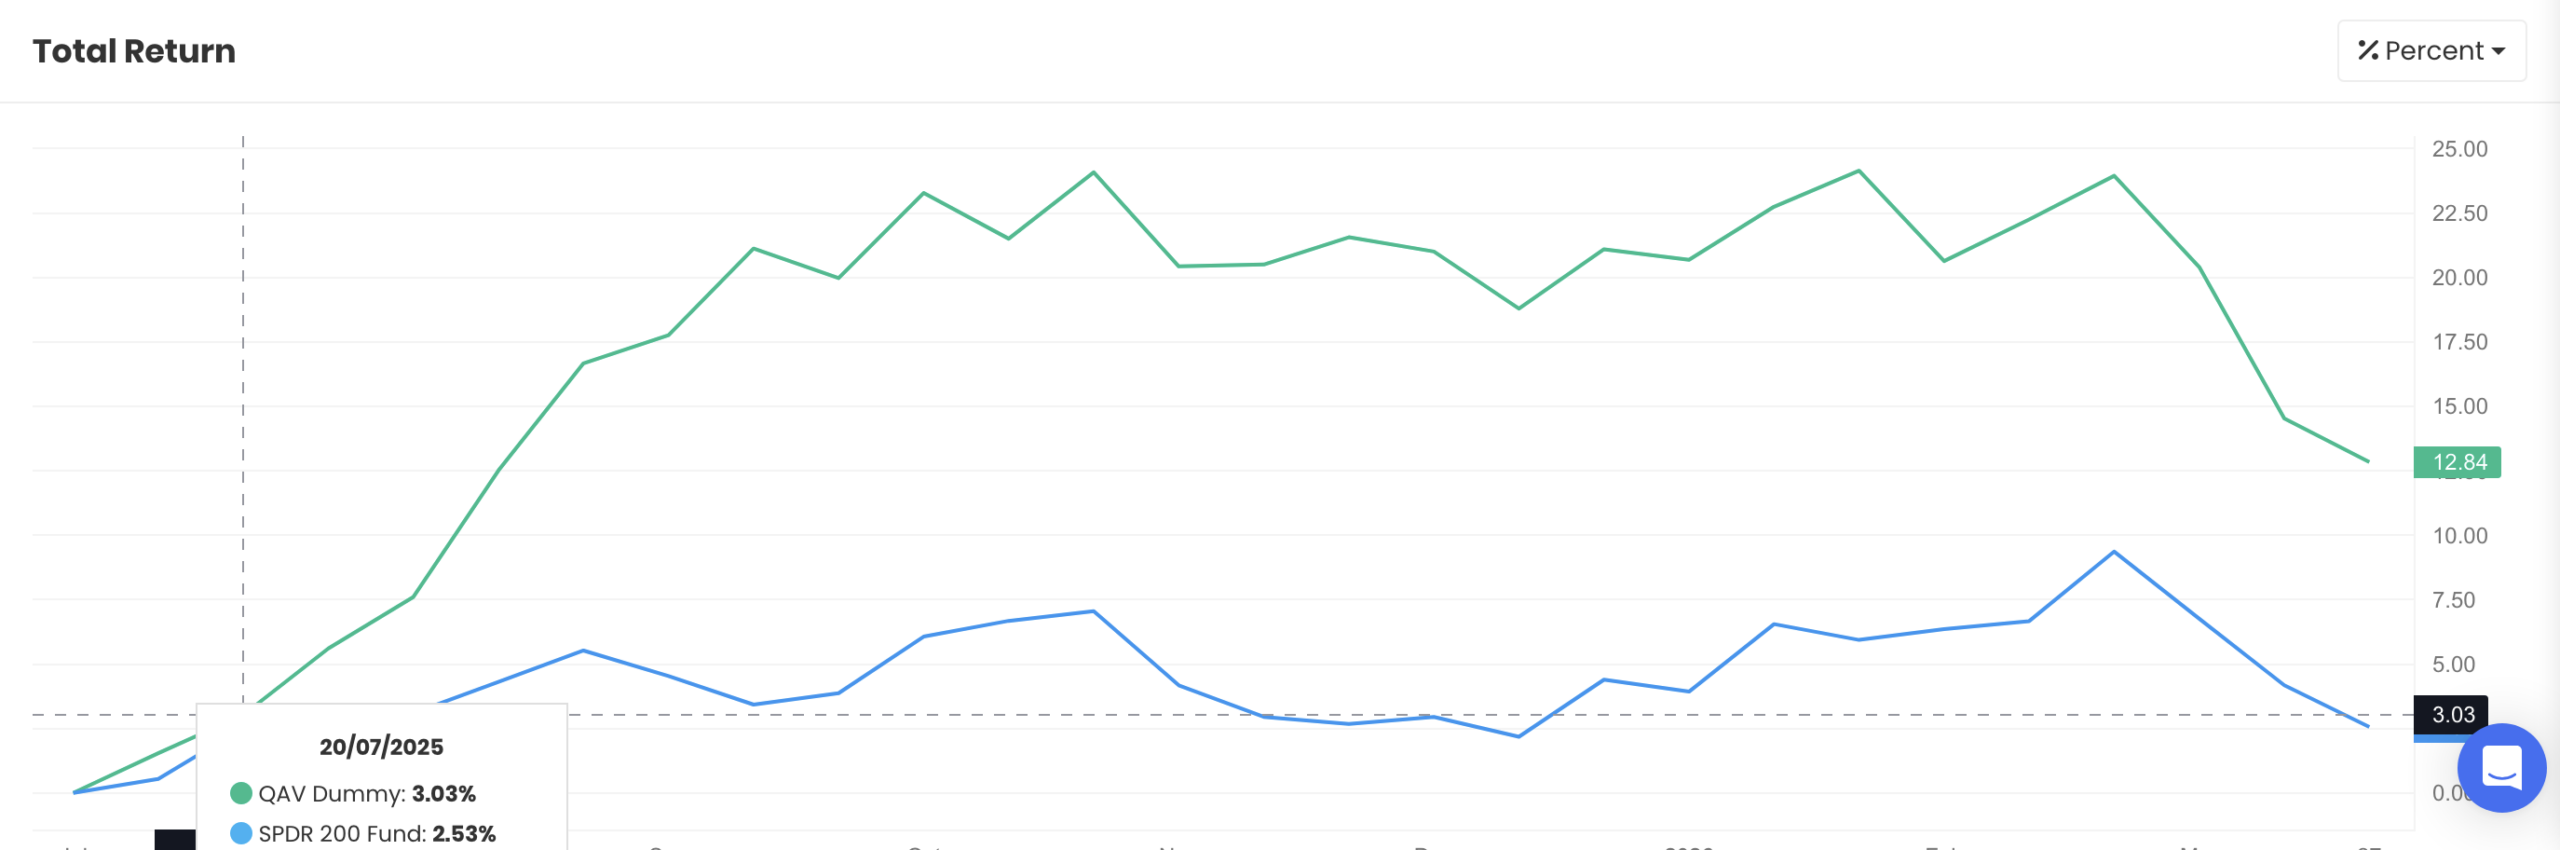
For FY26: The QAV portfolio has delivered approximately 12.8% returns for the financial year to date, significantly outperforming the ASX 200 benchmark which sits at around 3.0%. This represents a performance gap of nearly 10 percentage points in QAV’s favour. While both investments experienced volatility throughout the period, the QAV strategy has maintained its lead despite some recent decline from earlier peaks.
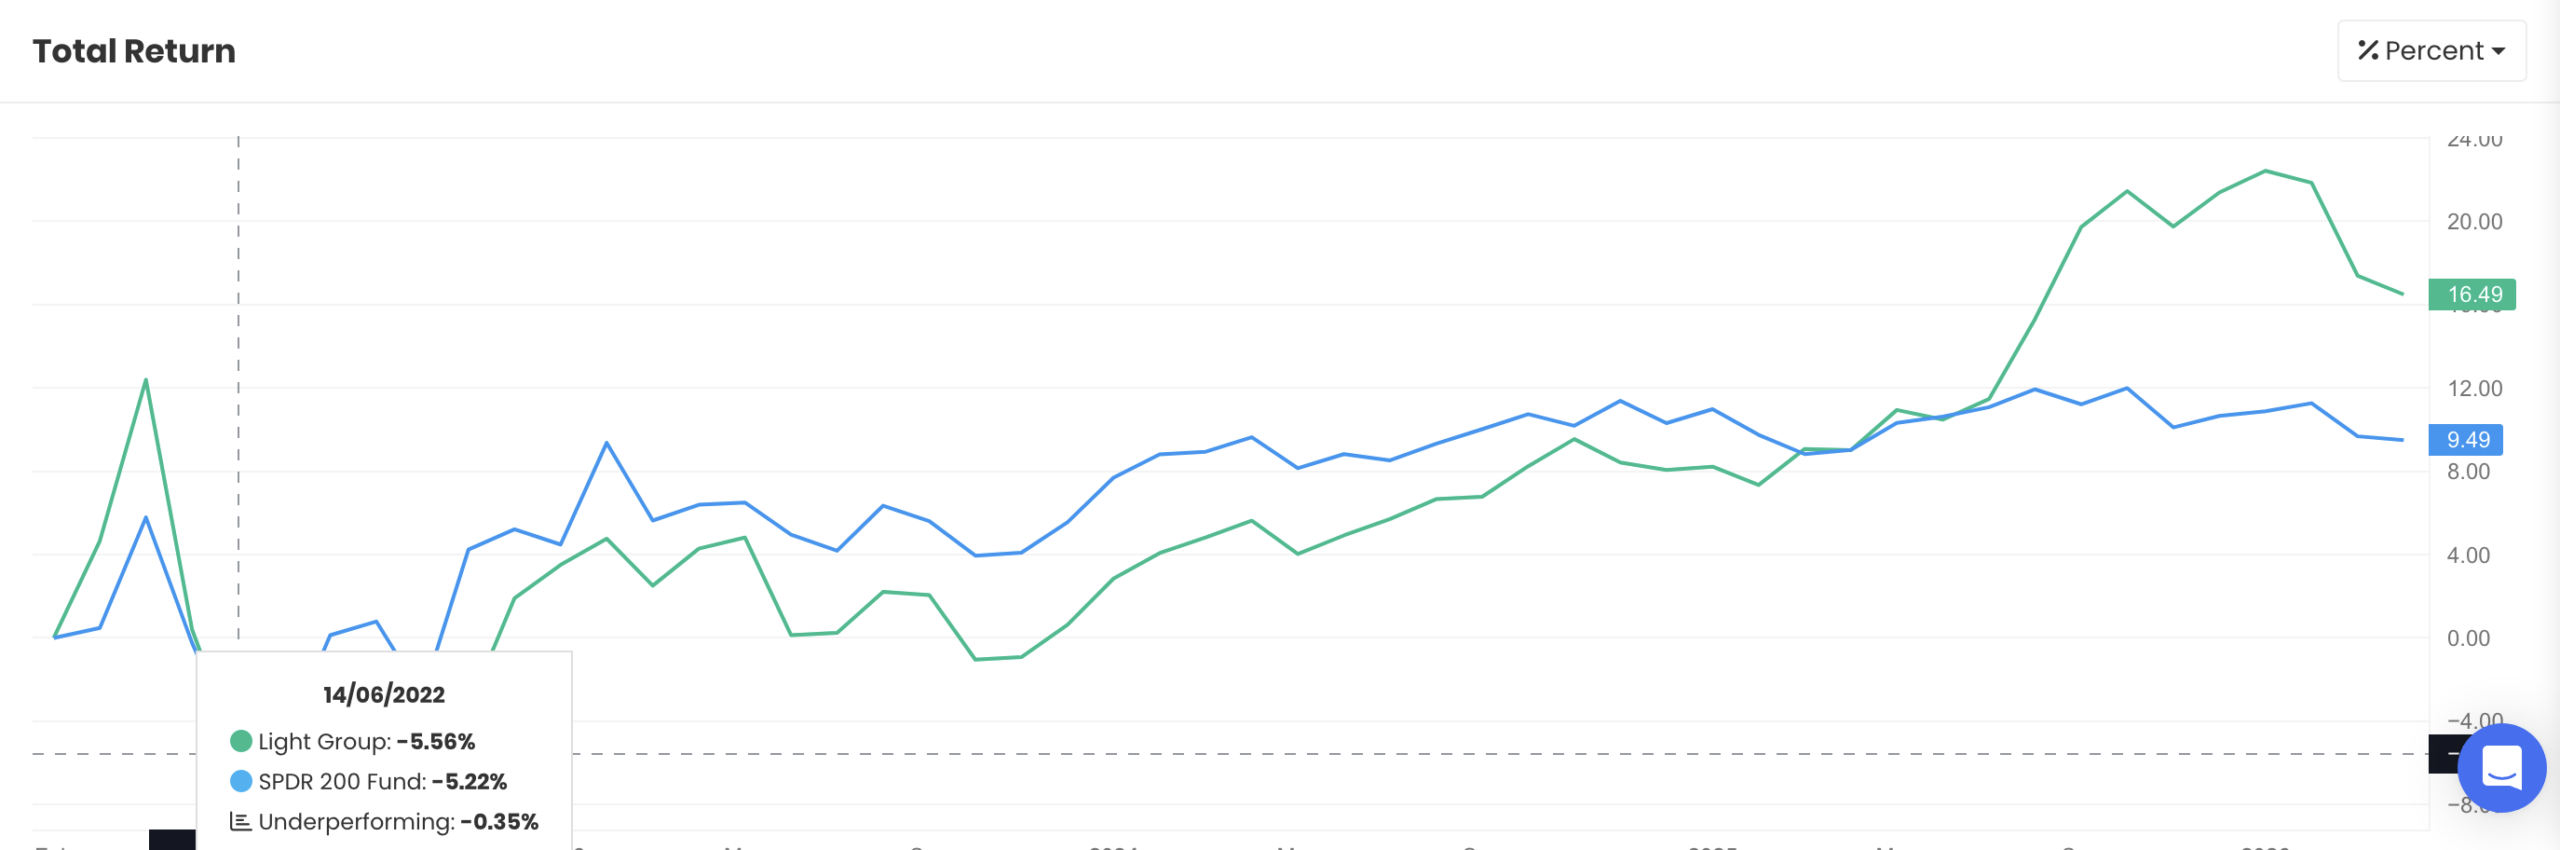
QAV LIGHT
All Time
The QAV AU Light portfolio currently sits at approximately 16.5% total return, significantly outperforming the ASX 200 benchmark which stands at around 9.5%. This represents an outperformance of roughly 7 percentage points over the measurement period.
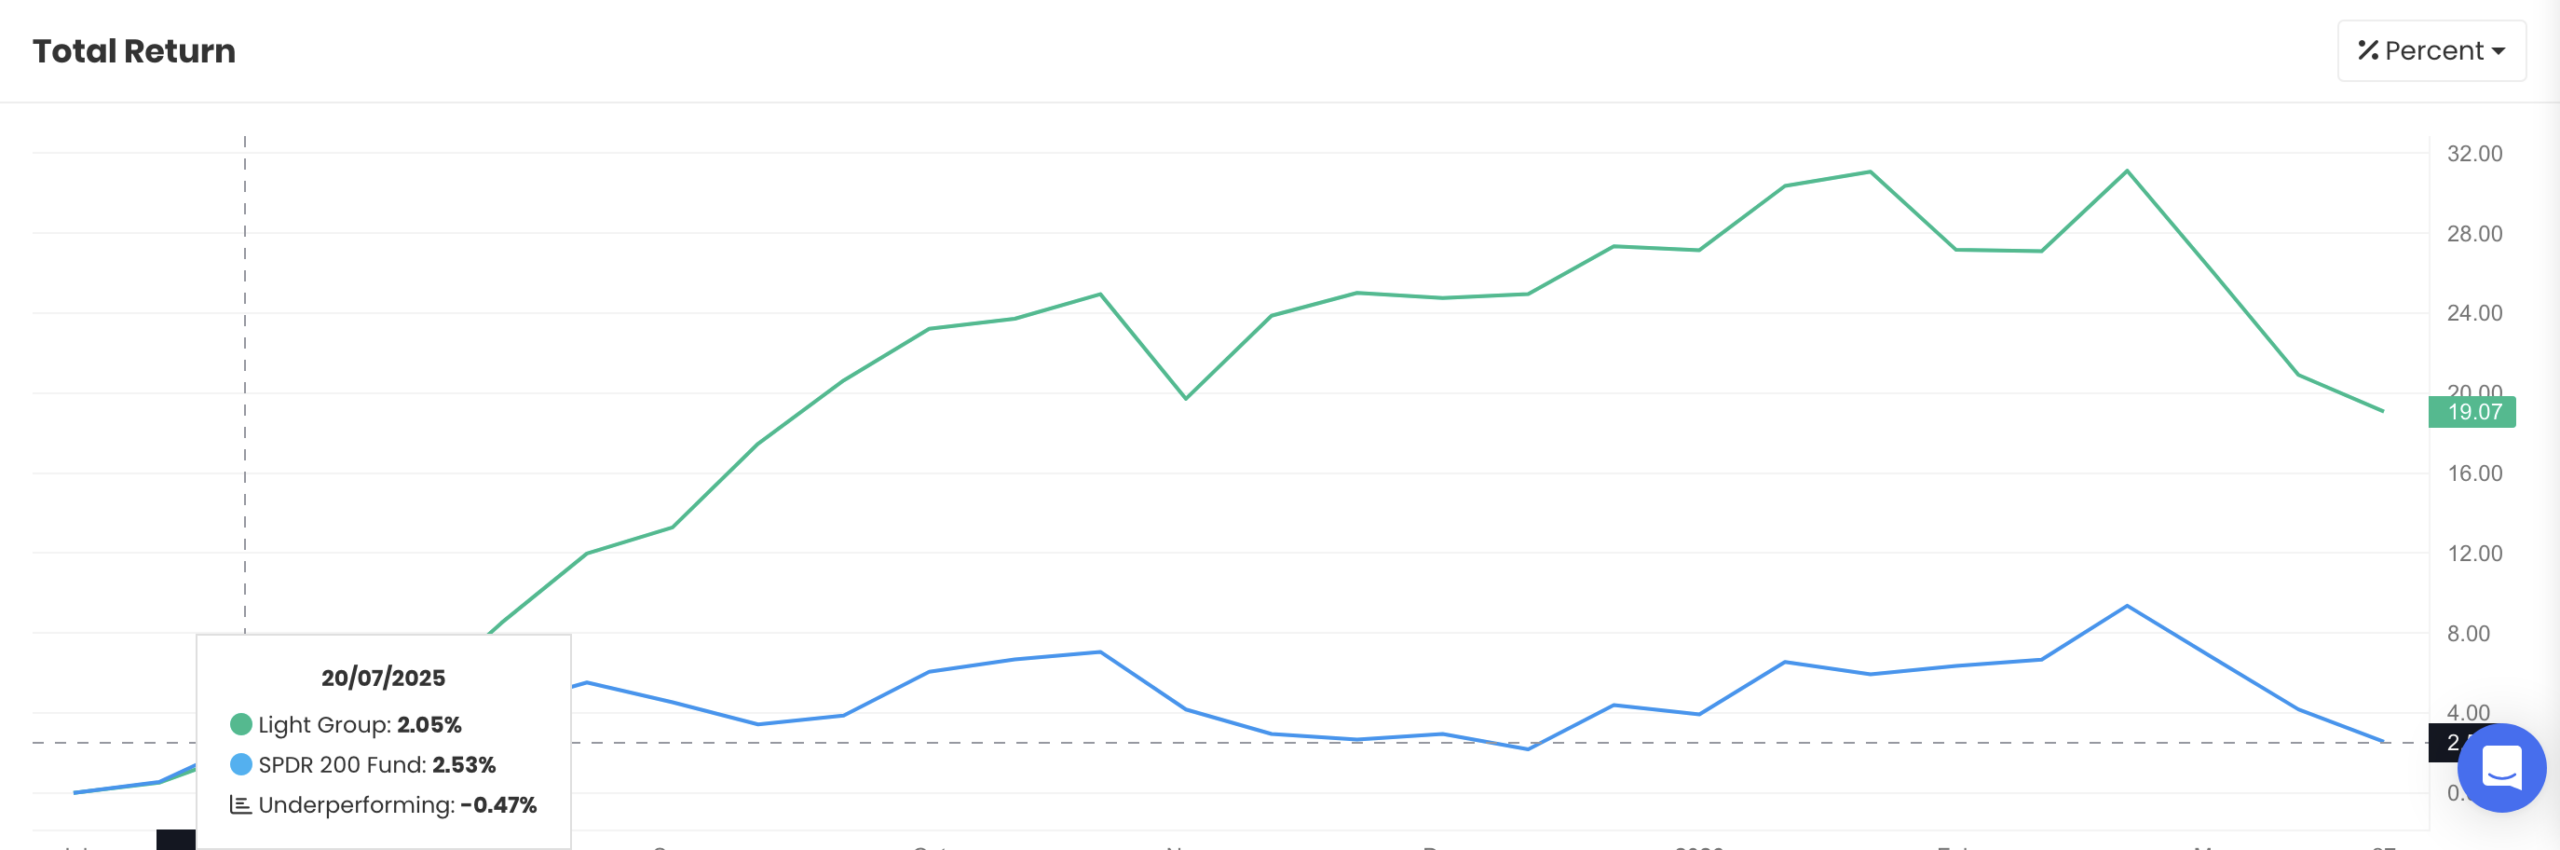
Financial Year to Date
QAV AU Light portfolio currently sits at approximately 19% for the financial year to date, significantly outperforming the ASX 200 benchmark which stands around 3%.
Last 30 Days
Over the past 30 days, the QAV AU Light portfolio declined approximately 8.94% compared to the ASX 200’s fall of 6.37%.
Last 12 Months
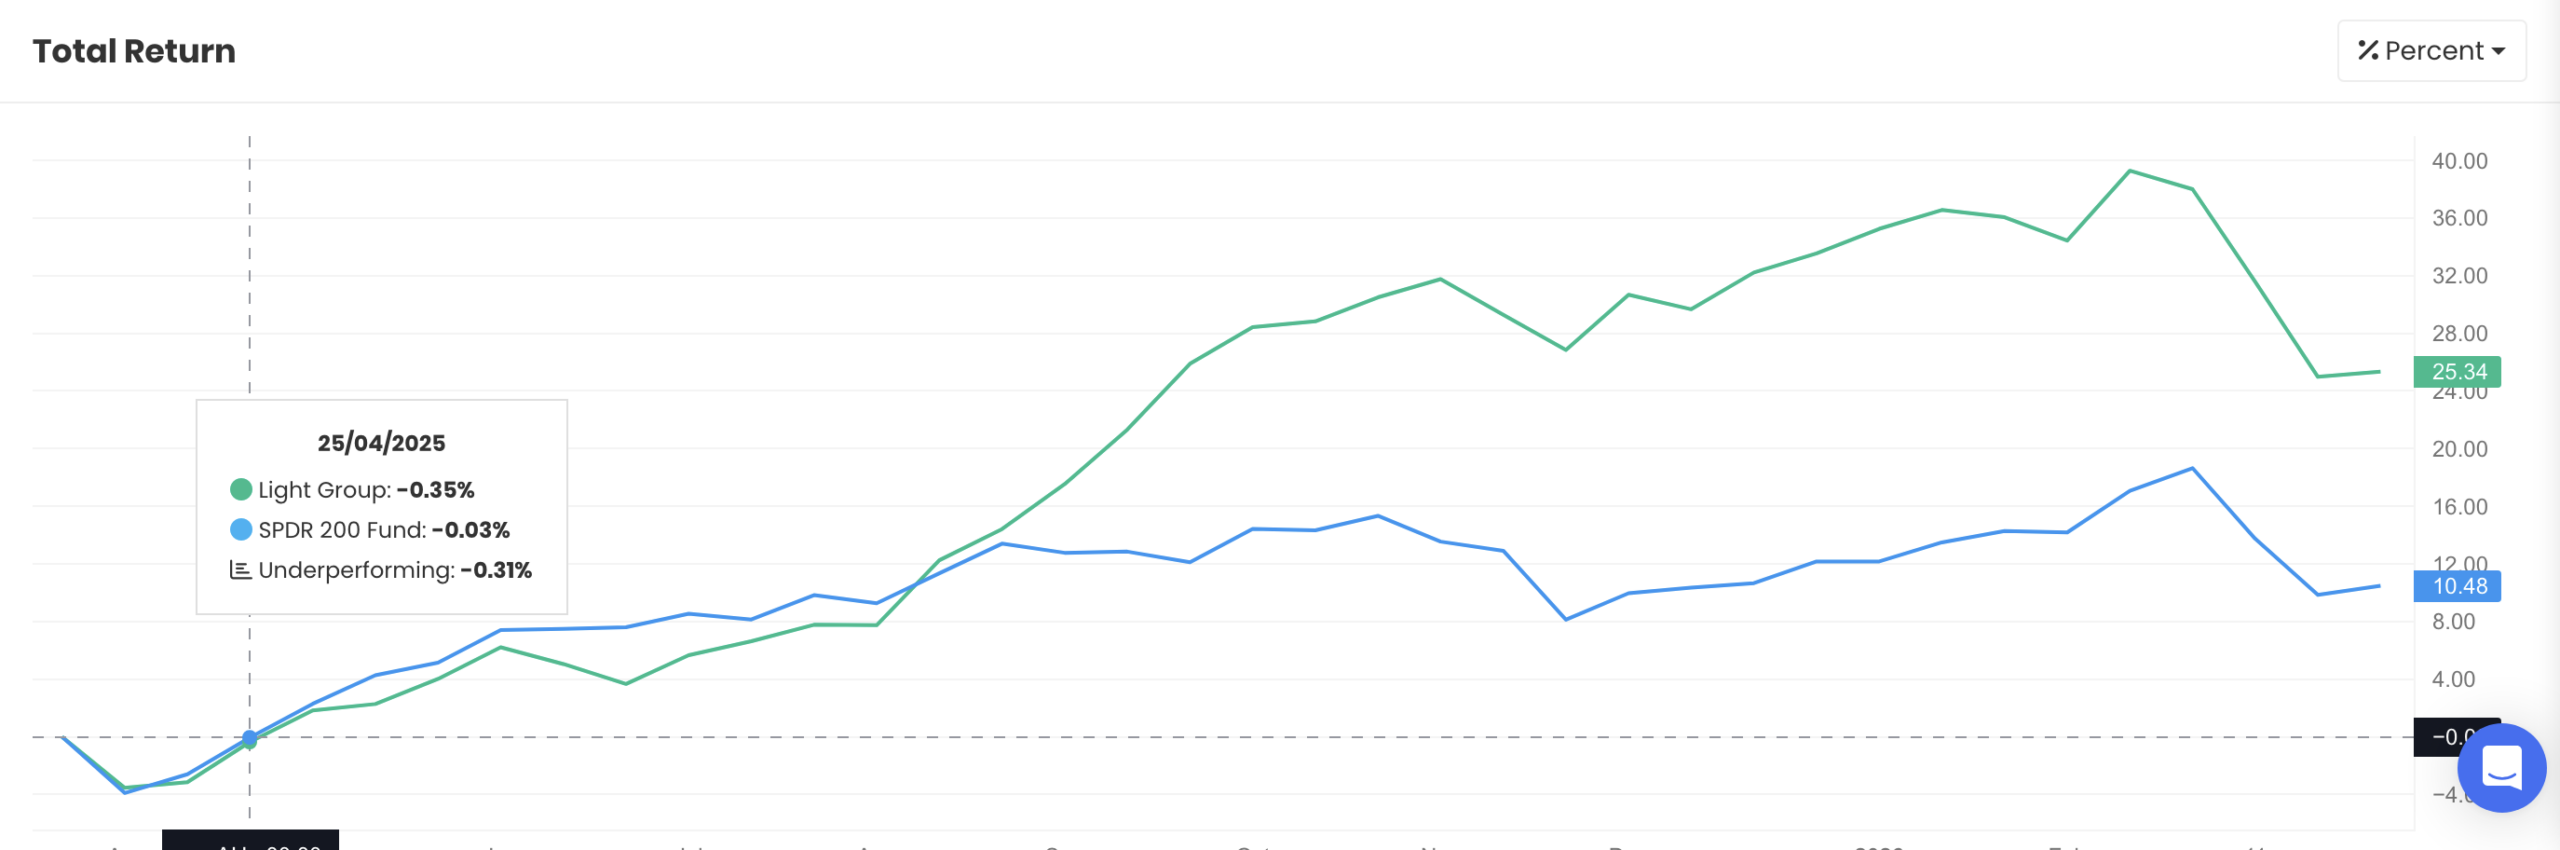
Over the past 12 months, the QAV AU Light portfolio delivered approximately 25% total returns compared to the ASX 200’s 10% return. The QAV strategy significantly outperformed the benchmark by roughly 15 percentage points, demonstrating strong stock selection during this period.
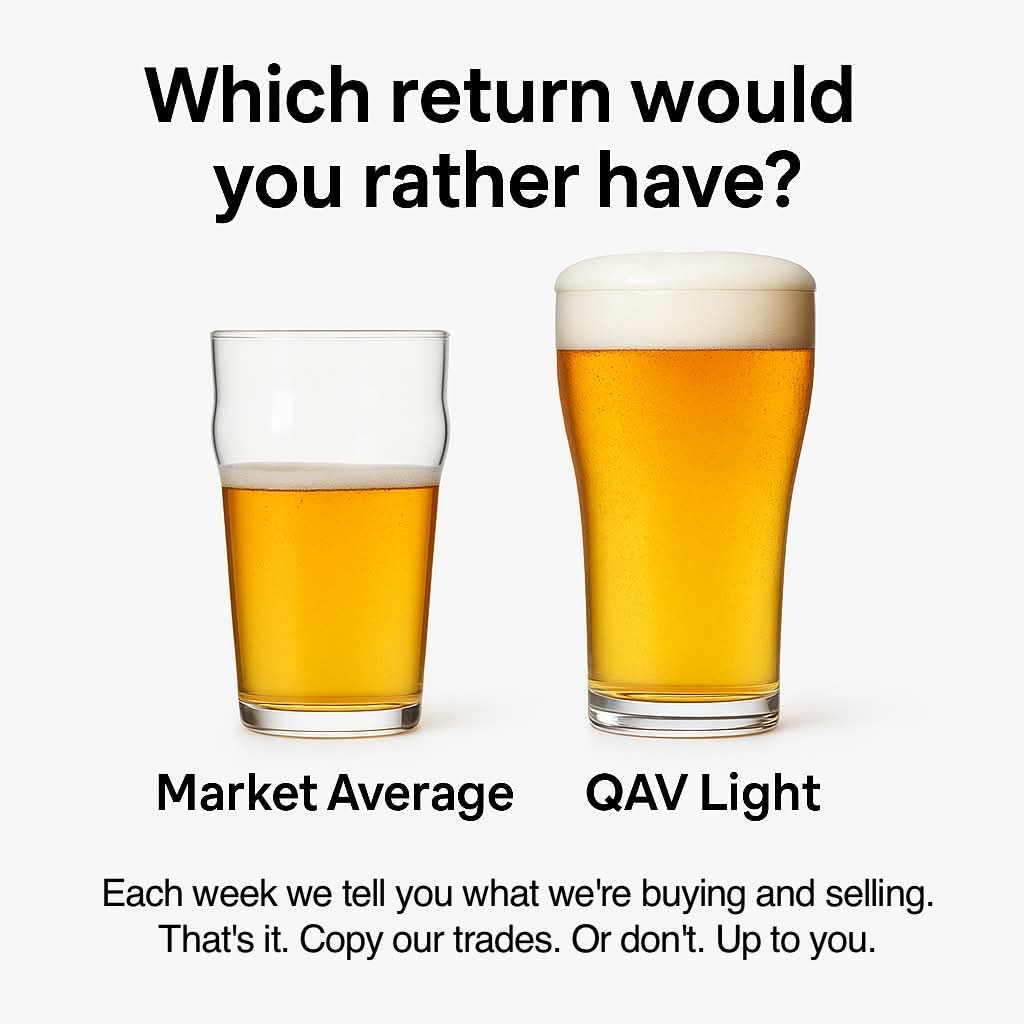
Become a QAV Light Member today and start your investing on the right track
If you want to find out what we’re trading in QAV Light each week, sign up to become a member. You’ll get an email from me every Monday letting you know what we’re buying and selling in that portfolio. You can choose to copy our trades or not. It’s the easiest way to start your rules-based investing career… and you don’t even need to know the rules. I’ll follow the rules for you. It’s a good first step to eventually becoming a QAV Club member and learning how to run the system by yourself.
(Note: Americans interested in joining QAV Light or Club please go here instead.)
AMERICAN
QAV DUMMY
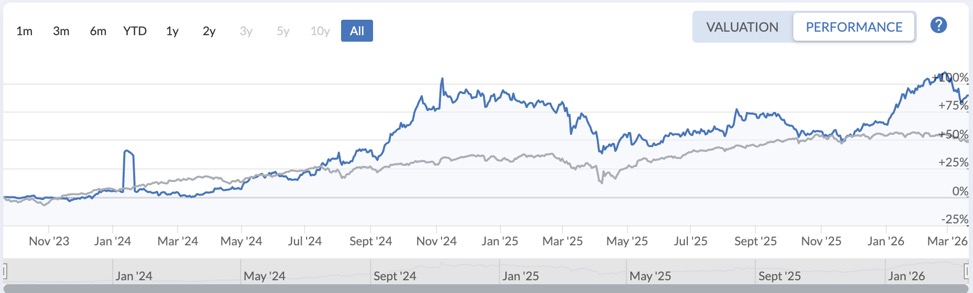
Since inception (Sep 2023), our portfolio is +89% vs the S&P 500 +48%. Not quite double market but pretty close.
Our U.S. portfolio for the last 30 days was ‑7.6% vs ‑3.7% for the S&P 500.
No trades this week.
QAV LIGHT
I recently started our U.S. Light portfolio, and it’s off to a slow start, but it outperforming the index — it is currently +1.39% vs the S&P 500 ‑6%. It’s had a particularly good month, +4% vs the index ‑6%.
THIS WEEK’S EPISODES
QAV AU #912 — Chicken Little

We Press the Button on KODK – QAV America #45
STOCK NEWS AND UPDATES
COMMODITIES
This week the big changes to commodities were the following:
Iron Ore — BUY
Gold (USD) — JOSEPHINE
Steel— BUY
LNG — JOSEPHINE
Nickel — SELL
Wheat — SELL
Lithium — JOSEPHINE
DISCLOSURE
Please review our trading and disclosure policy.
SIGNING OFF
Well legends, another big week in the books! We dug deep into KAR on the Aussie side and KODK across the Pacific — both showing us that patient value hunters can still find diamonds in the rough when the market gets emotional. The commodities are painting an interesting picture with iron ore and steel flashing green while wheat’s telling us to take profits — classic cyclical rotation that reminds us why we stick to the process rather than chasing headlines. Keep trusting the checklist, keep backing yourselves, and remember that building wealth is a marathon, not a sprint.
SSDD!
- Cam
That’s it for the week!
QAV A GOOD SHAREMARKET!
Got a question? [email protected]