CTI Logistics Limited (CLX) Stock Report
Company Overview
CTI Logistics Limited operates primarily in the transport and logistics sector within Australia, offering a comprehensive suite of services through its various segments: Transport Services, Logistics Services, and Property. Established in 1972 and headquartered in West Perth, this company has built a robust profile in transport solutions, including courier services, taxi trucks, parcel distribution, fleet management, heavy haulage, and freight forwarding.
In addition, CTI provides logistics support to various industries, including temperature-controlled storage and delivery for food and health products, and logistical services tailored for the minerals and energy sector. The company also ventures into security systems and records management, which further diversify its revenue streams. The breadth of services positions CTI strategically within the logistics ecosystem, catering to various client needs across multiple sectors.
Share Price Analysis
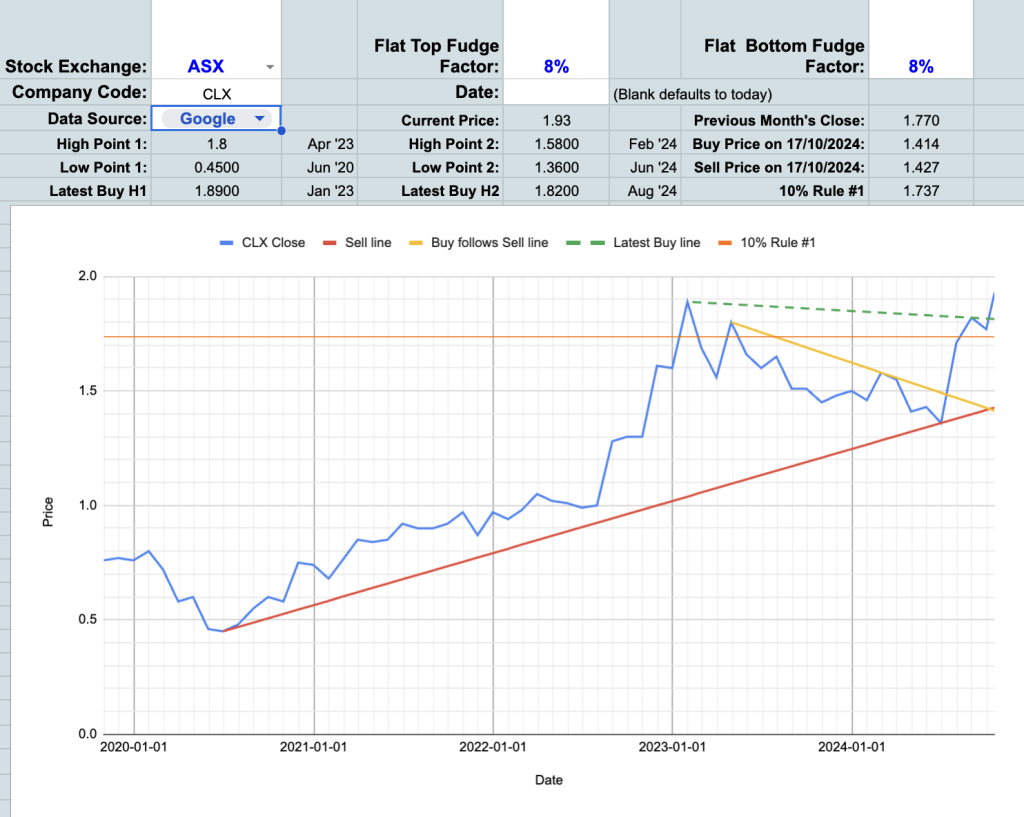
The current share price at the time of our analysis was $1.93. The share price is above our Intrinsic Value 1, indicating that the stock might be overvalued at this level.
Average Daily Turnover
The average daily trade for CTI Logistics is reported at $0.029 million, categorising it as a small-cap stock. For potential investors, this classification may imply lower liquidity and potentially higher volatility compared to larger-cap stocks. Investors holding larger parcels may find it more challenging to exit positions without impacting the share price significantly.
Dividend Yield
The dividend yield is not higher than the average mortgage rate. This means the stock does not score positively on this metric, indicating that investors reliant on dividend income may find this stock less appealing for income generation.
Financial Health
CTI Logistics has a strong financial health rating, with a stable trend. This stability suggests that the company is well-positioned to weather economic downturns and maintain operational efficiency, which is a positive indicator for investors.
Price-to-Earnings Ratio
The current PE ratio stands at 9.42. While this is not a record low over the last six reporting periods, it remains a relatively low figure, suggesting potential undervaluation.
Price to Operating Cash Flow
The Price to Operating Cash Flow ratio is reported at 3.66, which is under the threshold of 7. This demonstrates that the company’s operations generate sufficient cash flow to cover the stock price relatively quickly, indicating potential undervaluation and appealing to investors seeking value opportunities.
Share Price vs. Book Value
CTI’s share price is above the book price, which indicates a higher market valuation compared to the company’s equity. However, it does pass the “book plus 30%” test, suggesting that while the shares are trading at a premium, they are not excessively overvalued relative to the book value. This metric provides a degree of safety for investors, aligning with Warren Buffett’s philosophy of buying shares below 1.3 times book value.
Earnings Growth Assessment
The Growth/PE ratio is not available in current data, making it impossible to assess the company’s earnings growth relative to its PE ratio. In general, a Growth/PE ratio above 1.5 would signal that earnings are expected to grow faster than the market anticipates, but this analysis cannot be performed without the necessary data.
Ownership Structure
Directors of CTI Logistics hold 42.72% of the shares, marking a significant ownership level. This suggests strong alignment with shareholder interests, as directors have a vested interest in the company’s performance. Such ownership is often indicative of confidence in the company’s future prospects, which can be reassuring for potential investors.
Recent Market Sentiment
A new 3‑point upturn has been noted, indicating a positive shift in market sentiment towards the stock. This uptick could reflect improved investor confidence and may enhance the stock’s attractiveness moving forward.
Consistency of Equity Growth
The company has demonstrated consistently increasing equity, which is a strong indicator of effective management and operational success. This trend suggests that CTI is capable of reinvesting profits and growing its asset base over time.
Quality and QAV Scores
The Quality Score for CTI Logistics is an impressive 92%, indicating a high-quality investment relative to its peers. Meanwhile, the QAV score stands at 0.25, which is above the threshold of 0.10, making it a buy signal according to value investing principles.
STRENGTHS
- Strong financial health rating and stable trend.
- Current PE ratio of 9.42 indicates potential undervaluation.
- Price to Operating Cash Flow ratio of 3.66 suggests good cash generation relative to stock price.
- Directors own 42.72% of shares, indicating strong alignment with shareholder interests.
- Consistently increasing equity showcases effective management.
- High Quality Score of 92% and a positive QAV score of 0.25.
WEAKNESSES
- Current share price is above Intrinsic Value 1, suggesting potential overvaluation.
- Average daily turnover of $0.029 million classifies it as a small-cap stock, which may imply liquidity risks.
- Dividend yield does not exceed the mortgage rate, limiting appeal for income-focused investors.
- Growth/PE ratio not available, restricting earnings growth assessment.
Conclusion
CTI Logistics Limited presents a value investment opportunity. While the share price is above intrinsic valuations and the dividend yield is below the bank debt rate, the company’s strong financial health, low PE ratio, and significant director ownership suggest potential for long-term growth. The positive QAV score also places it favorably among value stocks. While the value metrics are mixed, it has a positive QAV score and ranks high on our weekly buy list.
Disclaimer: This podcast is an information provider and in giving you product information we are not making any suggestion or recommendation about a particular product. The information has been prepared without taking into account your individual investment objectives, financial circumstances or needs. Before you decide whether or not to acquire a particular financial product you should assess whether it is appropriate for you in the light of your own personal circumstances, having regard to your own objectives, financial situation and needs. You may wish to obtain financial advice from a suitably qualified adviser before making any decision to acquire a financial product. Please note that all information about performance returns is historical. Past performance should not be relied upon as an indicator of future performance; unit prices and the value of your investment may fall as well as rise. The results are general advice only and not personal product advice.
Transparency is important to us. We will always be very open and honest about the stocks we own. We will also always give our audience advance notice when we intend to buy or sell a stock that we are going to talk about on the podcast. This is so we can never be accused of pumping a stock to our own advantage. If we talk about a stock we currently own, we will make it known that we own it.
This email is authorised by Anthony Kynaston (AR No. 001292718).
Copyright © 2022 Spacecraft Publishing Pty Ltd trading as QAV (“QAV”) (ABN 41 163 119 300) which is a Corporate Authorised Representative (CAR 001292718) of MF & Co. Asset Management Pty Ltd (AFSL 520442).
No part of this content may be reproduced in any form without the prior consent of Spacecraft Publishing.
| Metric | Value |
|---|---|
| Company Name | CTI Logistics Limited |
| Ticker | CLX |
| Current Share Price | $1.93 |
| Average Daily Trade | $0.029 million |
| QAV Score | 0.25 |
| Quality Score | 92% |
| Is Star Stock | No |
| Price <= Consensus Valuation | No |
| Price <= Intrinsic Value 1 | No |
| Price <= Intrinsic Value 2 | Not Available |
| Price <= Book Price + 30% | Yes |
| New 3‑point upturn | Yes |
| Growth/PE Ratio | Not Available |
| Growth/PE > 1.5 | Not Available |
| Price < Book Price | No |
| Consistently Increasing Equity | Yes |
| Yield > Bank Debt Rate | No |
| Financial Health Rating | Strong |
| Financial Health Trend | Stable |
| Forecast IV > 2 x Current Share Price | No |
| Directors Own Significant Shares | Yes |
| % Holding of All Directors | 42.72% |
| EPS Forecast Year 1 | nan |
| PE (Price-Earnings Ratio) | 9.42 |
Thanks Cam
Excellent just need it for all stocks on the buy list or top 5