Investment Report on GenusPlus Group Ltd (Ticker: GNP)

Company Overview
GenusPlus Group Ltd operates in the Australian market, focusing on the installation, construction, and maintenance of power and communication systems. The company is structured into three distinct segments: Infrastructure, Communications, and Industrial. Its diverse service offerings include planning, designing, constructing, operating, testing, maintaining, managing, and decommissioning power network assets for various sectors including electricity utilities, telecommunications, and mining.
Key profit centres within GenusPlus encompass electrical and instrumentation services tailored for the mining, oil and gas, infrastructure, and power generation sectors. The company also provides comprehensive engineering and design solutions, high and low voltage electrical installations, and asset management services, particularly for the resource sector. More recently, GenusPlus has made strides into renewable energy, offering EPC solutions for wind, solar, and power systems storage, enhancing its market position in the burgeoning green energy landscape.
Share Price Analysis
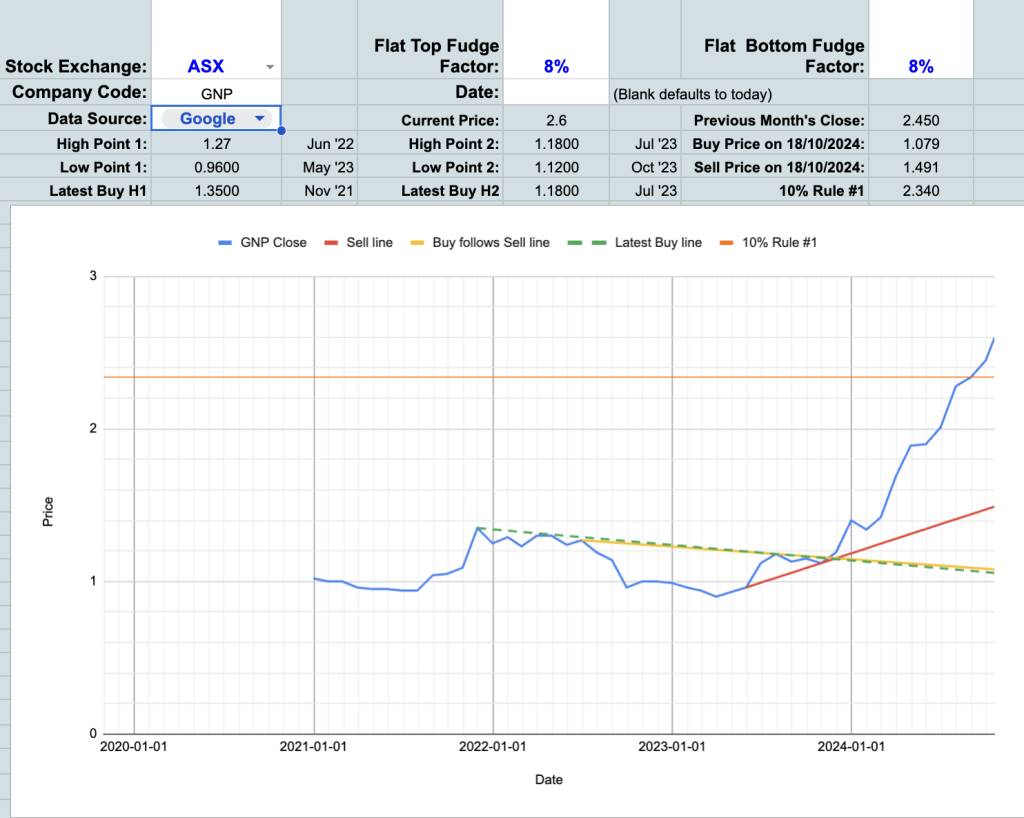
The share price of GenusPlus at the date of analysis is $2.59. However, the share price is above our intrinsic value #1, and also above our intrinsic value #2. This indicates the stock might be overvalued at the current price level.
Average Daily Turnover
With an average daily trade of $0.392 million, GenusPlus is classified as a small-cap stock. This classification may impact potential investors regarding their exit strategy. Those considering large parcels may find it more challenging to liquidate positions without impacting the stock’s price due to lower trading volumes compared to larger-cap stocks.
Dividend Yield
The dividend yield is not higher than the average mortgage rate, so it doesn’t score for this metric. A higher yield than the bank debt rate is generally favourable, as it indicates that investors could use dividend income to cover borrowing costs.
Financial Health
GenusPlus enjoys a strong financial health rating, with a stable trend, suggesting a solid management framework and the ability to weather economic fluctuations effectively. This stability is crucial for investors seeking long-term growth.
Price-to-Earnings Ratio
The current PE ratio stands at 24.67. Although this metric does not represent a record low over the last six reporting periods, it does provide a baseline for evaluating the company’s valuation relative to its earnings.
Price to Operating Cash Flow Ratio
The Price to Operating Cash Flow ratio is 5.56, which is below our threshold of 7. This indicates that it would take approximately 5.56 years for the company’s operations to generate enough cash to cover the stock price, which is a reasonable time frame.
Book Value Analysis
When evaluating the company’s price in relation to book value, it is essential to note two aspects: the stock price is higher than the book price, and it also fails the “book plus 30%” test. Ideally, investors want to pay no more than $1.33 for every $1 of equity. The current situation implies a higher risk profile for investors as there is no buffer margin.
Earnings Growth Assessment
The Growth/PE ratio is 1.8, which is above the threshold of 1.5, suggesting that the company’s earnings are growing at a rate that exceeds what the current PE ratio implies. This scenario indicates potential undervaluation, as the market may not fully recognise the company’s growth prospects.
Ownership Structure
Significantly, directors hold 53.82% of shares, which is considered substantial ownership (over 10%). This level of director ownership suggests strong alignment with shareholder interests, enhancing confidence among investors.
Market Sentiment
There has been no new 3‑point upturn noted recently, because the sentiment has been positive since it crossed the buy line in late 2023.
Consistency of Equity Growth
The company has demonstrated consistently increasing equity, reflecting strong management quality and a robust operational framework. This trend is a positive indicator for potential investors.
Quality and QAV Scores
The Quality Score stands at 73%, which is close to, but not above, our ideal threshold of 75%. The QAV Score is 0.13, which is above the our cut-off threshold of 0.10. These scores indicate that the stock may present a worthwhile investment opportunity.
STRENGTHS
- Strong financial health with a stable trend.
- Potential undervaluation indicated by Price to Operating Cash Flow ratio.
- Directors hold a significant percentage of shares (53.82%), aligning their interests with shareholders.
- Consistently increasing equity, signalling effective management.
- Quality Score of 73%, indicating a high standard of operational performance.
WEAKNESSES
- Current share price is above both intrinsic values.
- Dividend yield does not exceed bank debt rate.
- The share price exceeds both the book price and the book price plus 30% test, indicating potential risk.
Conclusion
In summary, while the value metrics are mixed, GenusPlus Group Ltd possesses strengths that may appeal to investors. The positive QAV score and significant director ownership reinforce the company’s potential as a reasonable investment. The consistent equity growth and strong financial health further support this assessment. Investors should consider their risk tolerance and investment horizon before making a decision.
| Metric | Value |
|---|---|
| Company Name | GenusPlus Group Ltd |
| Ticker | GNP |
| Current Share Price | $2.59 |
| Average Daily Trade | $0.392 million |
| QAV Score | 0.13 |
| Quality Score | 73% |
| Is Star Stock | No |
| Price <= Consensus Valuation | Yes |
| Price <= Intrinsic Value 1 | No |
| Price <= Intrinsic Value 2 | No |
| Price <= Book Price + 30% | No |
| New 3‑point upturn | No |
| Growth/PE Ratio | 1.8 |
| Growth/PE > 1.5 | No |
| Price < Book Price | No |
| Consistently Increasing Equity | Yes |
| Yield > Bank Debt Rate | No |
| Financial Health Rating | Strong |
| Financial Health Trend | Stable |
| Forecast IV > 2 x Current Share Price | No |
| Directors Own Significant Shares | Yes |
| % Holding of All Directors | 53.82% |
| EPS Forecast Year 1 | 15.2 |
| PE (Price-Earnings Ratio) | 24.67 |
| Record Low P/E (last 6 periods) | No |
| Price to Operating Cash Flow | 5.56 |
| Price to Operating Cash Flow <= 7 | Yes |
Disclaimer: This podcast is an information provider and in giving you product information we are not making any suggestion or recommendation about a particular product. The information has been prepared without taking into account your individual investment objectives, financial circumstances or needs. Before you decide whether or not to acquire a particular financial product you should assess whether it is appropriate for you in the light of your own personal circumstances, having regard to your own objectives, financial situation and needs. You may wish to obtain financial advice from a suitably qualified adviser before making any decision to acquire a financial product. Please note that all information about performance returns is historical. Past performance should not be relied upon as an indicator of future performance; unit prices and the value of your investment may fall as well as rise. The results are general advice only and not personal product advice.
Transparency is important to us. We will always be very open and honest about the stocks we own. We will also always give our audience advance notice when we intend to buy or sell a stock that we are going to talk about on the podcast. This is so we can never be accused of pumping a stock to our own advantage. If we talk about a stock we currently own, we will make it known that we own it.
This email is authorised by Anthony Kynaston (AR No. 001292718).
Copyright © 2022 Spacecraft Publishing Pty Ltd trading as QAV (“QAV”) (ABN 41 163 119 300) which is a Corporate Authorised Representative (CAR 001292718) of MF & Co. Asset Management Pty Ltd (AFSL 520442).
No part of this content may be reproduced in any form without the prior consent of Spacecraft Publishing.