In the year 2000, Enron had a P/E ratio of around 60. Wall Street analysts were tripping over each other to slap “Strong Buy” ratings on it. Fortune magazine named it “America’s Most Innovative Company” for six consecutive years. The P/E ratio said it was expensive but worthy of the premium. The business, it turned out, was a spectacular fraud. Within eighteen months, it was rubble.
The P/E ratio did not see it coming. It never does.

The First Metric You Learn Is the Least Reliable One
One of the first metrics you’ll encounter when you start your investing journey is the P/E Ratio — the price-to-earnings ratio. It’s calculated by dividing the current share price by earnings per share (EPS), and it’s everywhere. Analysts cite it, financial journalists lean on it, and it’s the first number that comes up whenever someone asks whether a stock looks “cheap” or “expensive.”
Which makes it a problem. Because it’s also one of the easiest numbers to manipulate.
Why People Believe It
The appeal is obvious. The P/E ratio is simple. You can look it up in three seconds. It gives you a number, and numbers feel objective. A P/E of 10 feels like a bargain. A P/E of 50 feels alarming. This apparent clarity is enormously comforting in a world that’s otherwise messy and unpredictable.
There’s also the historical pedigree. Benjamin Graham, the godfather of value investing, used earnings as a core part of his valuation framework. And when Graham is your intellectual ancestor, the idea carries real weight.
But here’s the thing about earnings: they’re a management decision.
The Levers Behind the Number
Let me put it this way. If you offered me a 50% share of your coffee shop for $100,000, the first question I’d ask is: how much cash is the business actually generating?
If you told me $200,000 a year in cash flow, I know I’d get my money back quickly — in rough terms, about a year, with zero overheads factored in. That’s a conversation worth having. If you told me the business was generating $10,000 a year, I know it’s going to take twenty years to get my money back. And twenty years is a long time. Think about what the world looked like twenty years ago. We were carrying Nokia 3310s and thinking Napster was a permanent lifestyle. A lot can change.
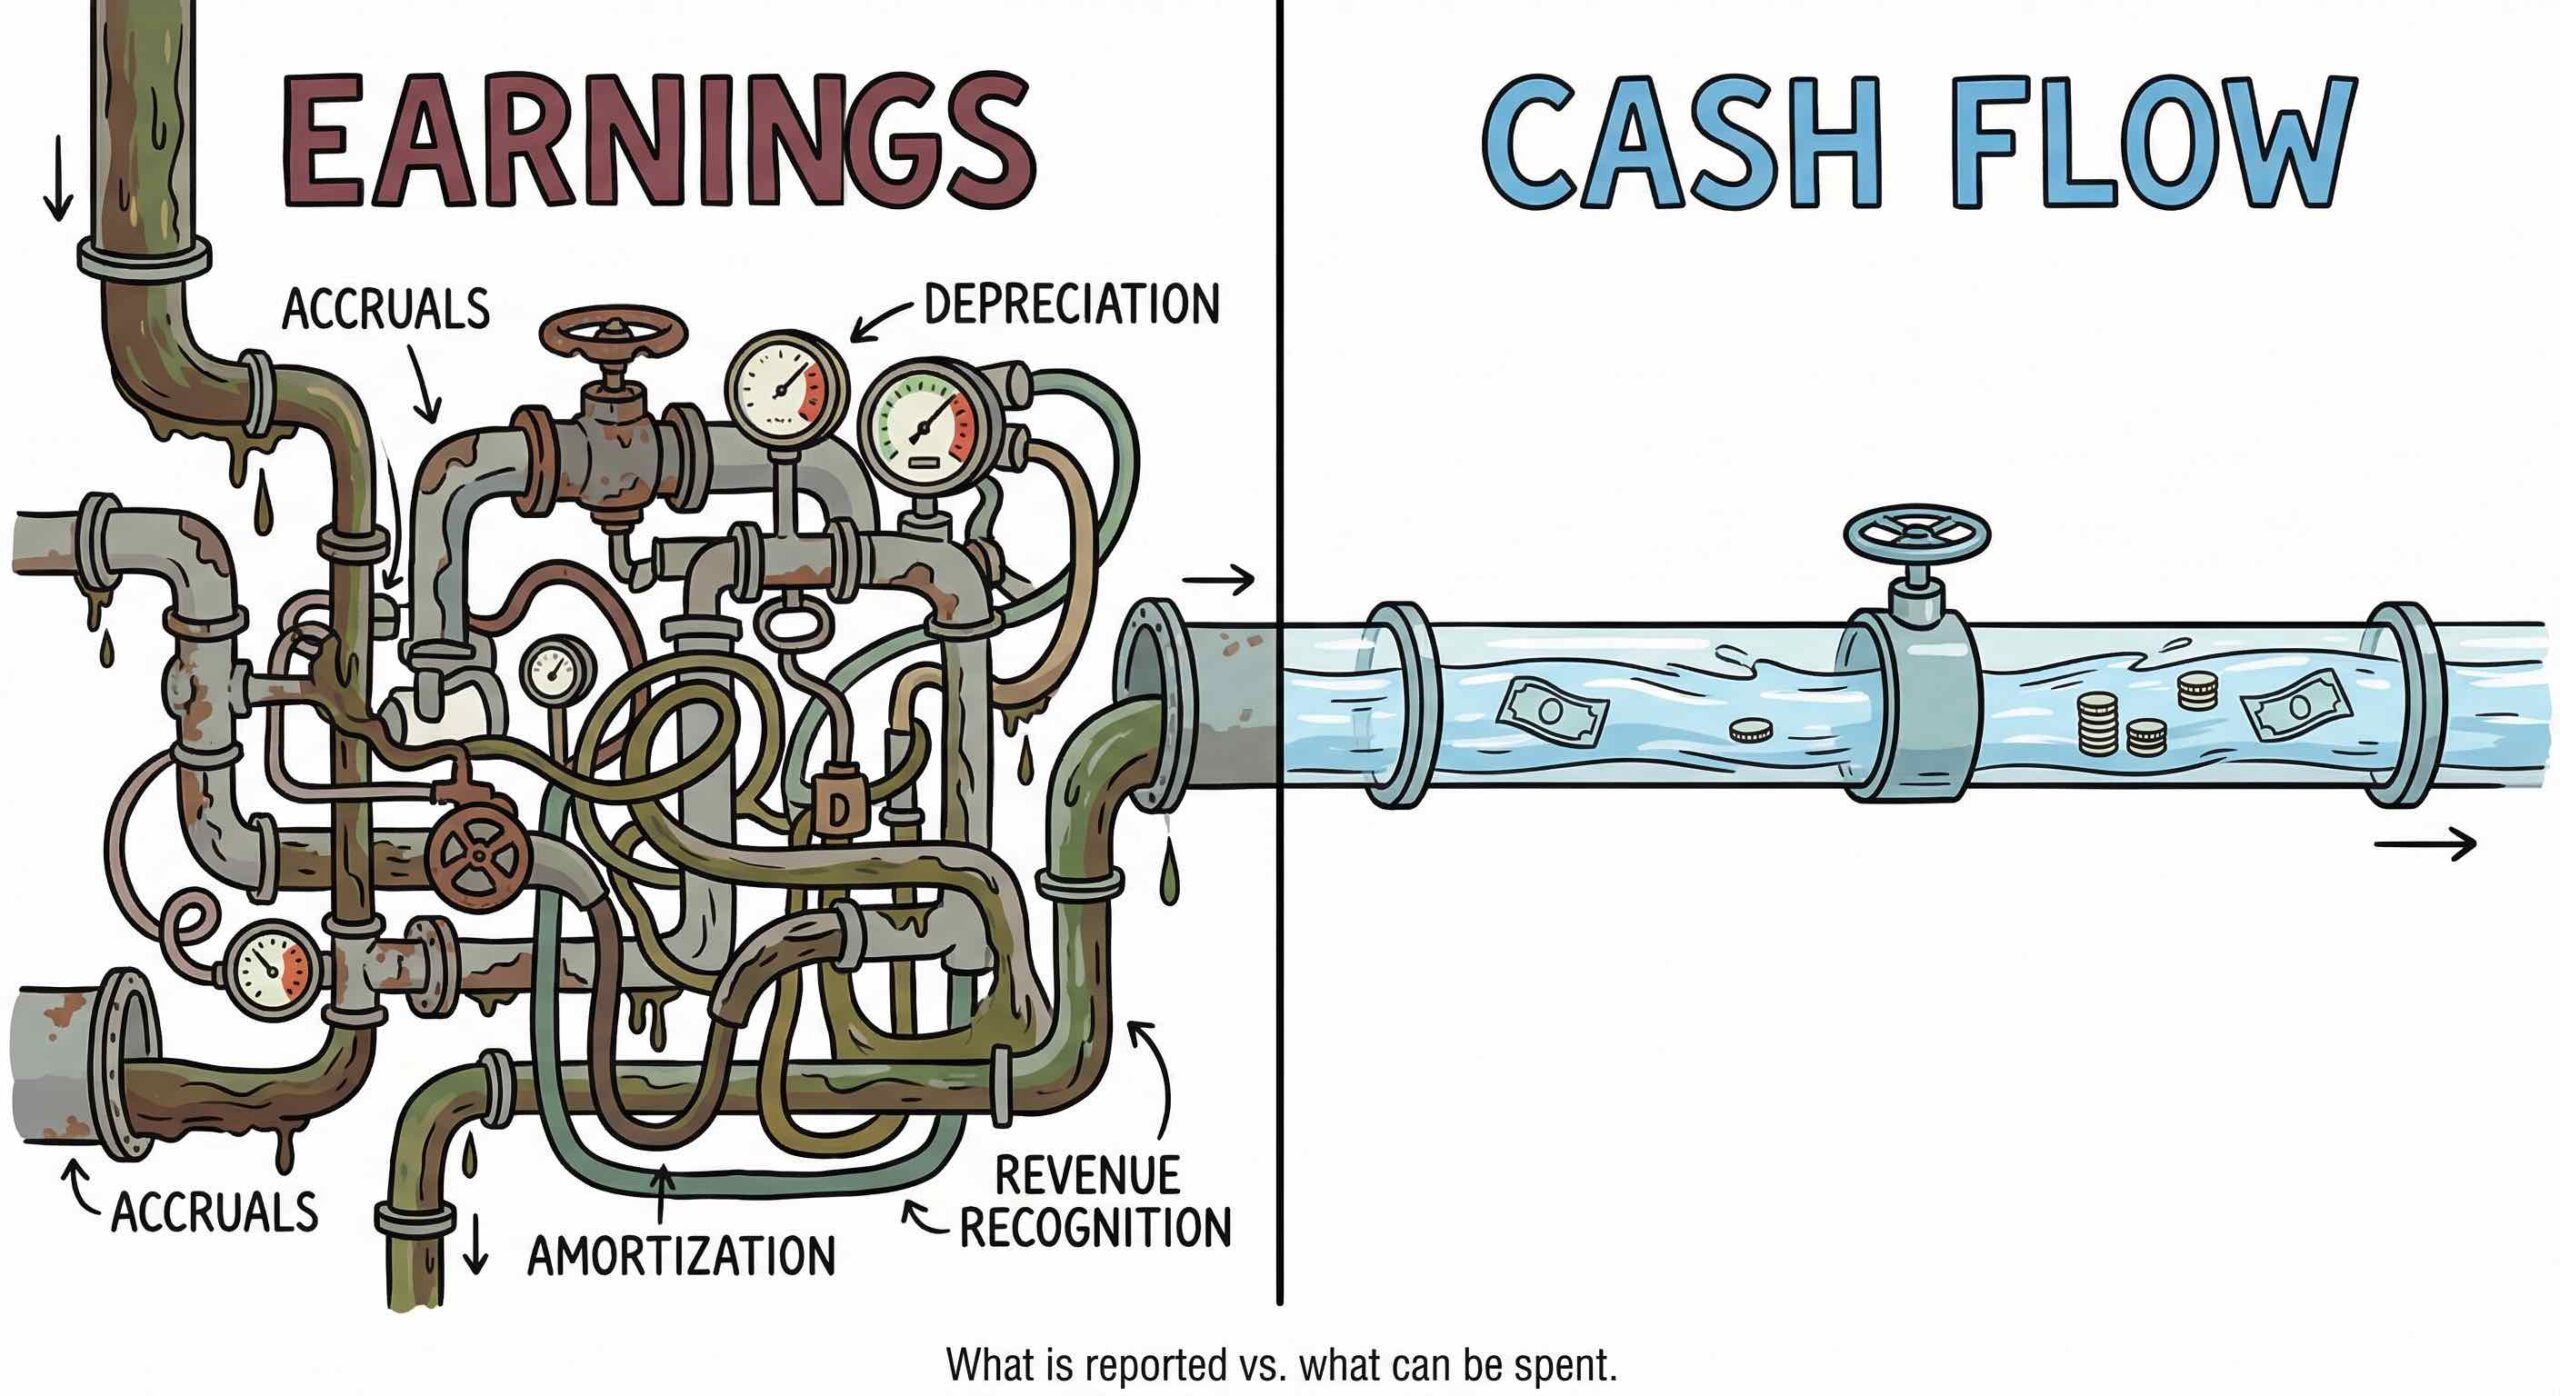
Cash flow tells me something real. Earnings tell me something that was constructed.
When we started doing the podcast, Tony explained the problem with earnings this way:
“What I’ve found over the years is that the further you go down a company’s financial reports, the more it becomes a management decision as to what figures get put in there. Operating cash flow, at the top of the statements, is the hardest thing to manipulate. Earnings are not. A manager can pull lots of levers across the three accounting statements — provisions on the balance sheet, adjustments to depreciation, decisions about goodwill amortisation — to make their numbers look however they want them to look. Sometimes they do it to hit a bonus target. Sometimes they do it to make next year’s comparisons easier. I’m not saying all managers are crooked. But it’s human nature to present yourself in the best possible light.”
This is why the big scandals — Enron, WorldCom, HIH in Australia — are always earnings scandals. Nobody fakes the cash coming through the front door. That’s much harder to hide.
What We Use Instead
When you start using QAV, you’ll see we focus on a metric called Price-to-Operating Cash Flow — which we call PROPCAF.
Unlike earnings, operating cash flow is the real money a business is generating from its actual operations, before the accountants have had a chance to finesse it. It sits at the top of the cash flow statement, and companies are legally required to report it. The further down the financial statements you go, the more room there is for interpretation. Operating cash flow sits right up there at the top, in the clearest possible air.
Over years of regression testing our checklist, we’ve found that PROPCAF is one of the single most powerful metrics we have. When we strip everything else out and test our metrics individually, PROPCAF by itself delivers the most outperformance of any single variable. Everything else we check — management ownership, financial health scores, revenue trends — adds to the result, but PROPCAF does the lion’s share of the work.
We Don’t Completely Ignore P/E
To be clear, we haven’t thrown P/E in the bin entirely. One of our checklist items looks at whether the current P/E is the lowest it’s been over the last three years — which is a useful signal that a stock is cheap relative to its own history.
But we’re not using P/E as a north star. We’re using it as a single data point in a much more rigorous framework. One instrument on a large dashboard, not the whole instrument panel.
The Question to Ask
So the next time someone tells you a stock looks cheap because the P/E is low, ask them one question: What’s the operating cash flow look like?
Because earnings are what management wants you to see. Cash flow is what’s actually happening.
At QAV, we’ll always take the real thing.
QAV Myth Killers is a weekly column in the QAV newsletter, taking apart a piece of
investing conventional wisdom. Read the series, or
get it by email every Friday.
General advice only. Spacecraft Publishing Pty Ltd
trading as QAV is a Corporate Authorised Representative (CAR 001292718) of MF & Co.
Asset Management Pty Ltd (AFSL 520442). This is general information and does not take your
personal circumstances into account. See our
disclosure.
Leave a Reply