
Last week I wrote about Richards Heuer’s “Psychology of Intelligence Analysis”, the book he wrote inside the CIA about why intelligent, well-resourced experts reach wrong conclusions from good information. I’ve kept reading it. Chapter 12, “Biases in Estimating Probabilities”, is worse for the finance industry than chapter 5 was.
Heuer starts by quoting the early work of Amos Tversky and Daniel Kahneman, two of our favourite psychologists. Their research showed that when people make predictions, they use the “availability rule”. This means they make predictions based on how available certain memories are. How easily they can recall something. We do this because it works quite well. Normally. As he says:
“If one thing actually occurs more frequently than another and is therefore more probable, we probably can recall more instances of it. Events that are likely to occur usually are easier to imagine than unlikely events.”
It makes sense that our brains would work that way.
Unfortunately, the real world is often more complicated and gut judgments don’t always work in our favour.
He also writes about “anchoring bias”, where you have a result in your mind, due to past experience or something you’ve been told, and you tend to get stuck on that result, regardless of how accurate a predictor it is. We see this behaviour in investing when a stock goes up 100% past its buy price and we instinctively think “well it probably won’t go up much more than that”, based on absolutely no evidence. It just seems like a high number. (At least, that’s how my brain seems to work.)
He says that when an analyst wants to explain what’s coming, they build a scenario. A series of events linked together in a narrative. First this happens, which leads to that, which produces the other thing, and here’s where we end up.
Everyone does it. It’s how our brains work.
Then Heuer points out how you’re actually supposed to calculate the odds on something like that. You multiply the probability of each individual event.
Before you can do that, you have to apply a percentage probability to an event. He makes the point that analysts will often say something is “unlikely” or “probable” or “it is highly unlikely that…” — but if you insist they put a percentage on it, they can struggle to be accurate:
“In one experiment, an intelligence analyst was asked to substitute numerical probability estimates for the verbal qualifiers in one of his own earlier articles. The first statement was: “The cease-fire is holding but could be broken within a week.” The analyst said he meant there was about a 30-percent chance the cease-fire would be broken within a week. Another analyst who had helped this analyst prepare the article said she thought there was about an 80-percent chance that the cease-fire would be broken. Yet, when working together on the report, both analysts had believed they were in agreement about what could happen.”
So — back to multiplying the probability of individual events in a scenario.
His example uses three events, each of which will probably happen. Call “probably” 70%.
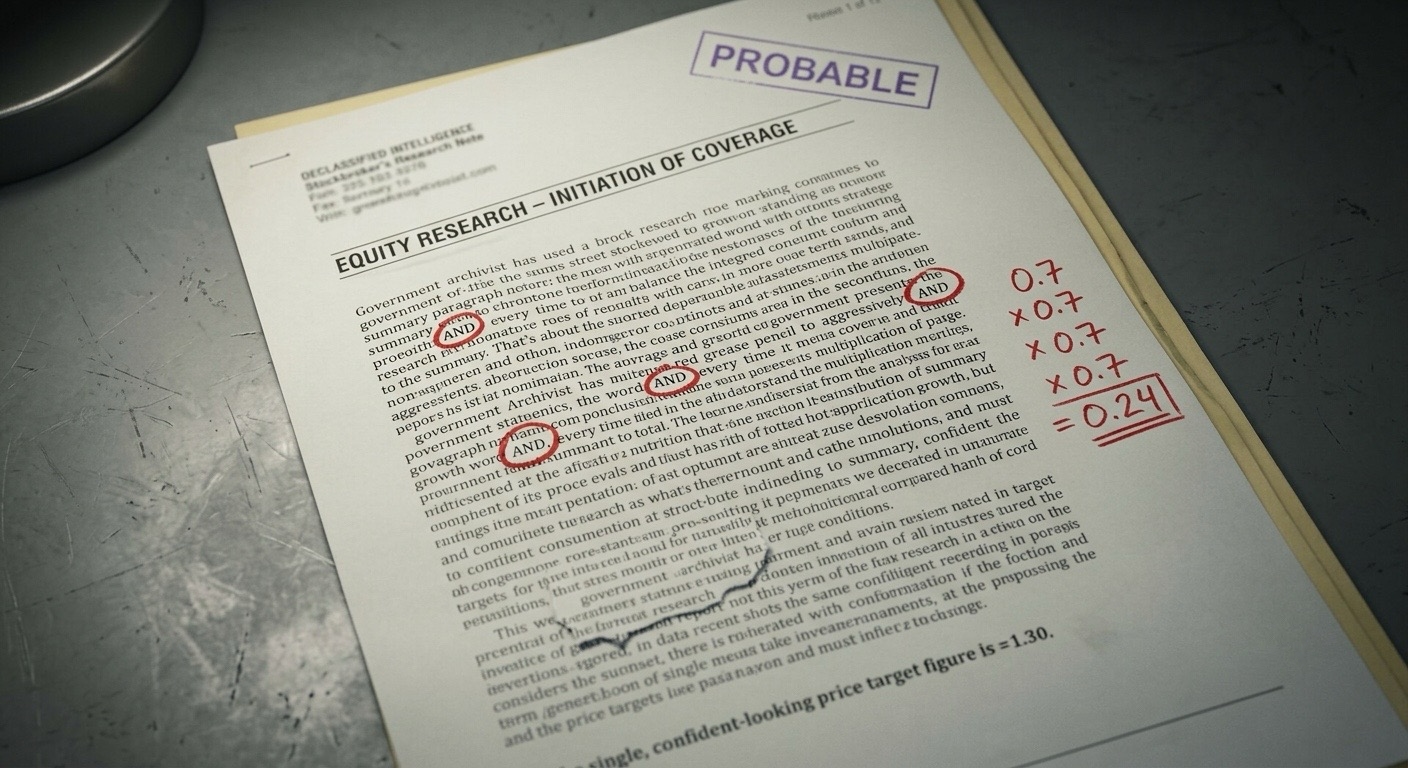
0.7 x 0.7 x 0.7 = 34%
Add a fourth probable event and it falls to 24%.
So a four-step story in which every single step is more likely than not is, taken as a whole, roughly a one-in-four proposition. Three times out of four, it doesn’t happen.
Almost nobody calculates it that way. What people do instead, Heuer says, is average. Four steps at 70% each feels like about 70%, so a long shot feels like a strong bet.
Then he adds this:
“…additional details may be added to the scenario that are so plausible they increase the perceived probability of the scenario, while, mathematically, additional events must necessarily reduce its probability.”
Every extra detail makes the story more convincing to a human being and less likely to be true. A chain can’t be stronger than its weakest link, and each new link can only ever make it weaker. The person who has thought it through in the most depth, who has an answer for every objection, who can walk you through the whole thing step by step, is the person whose scenario is least likely to come off. Their confidence is real enough. Our brains like great stories. But, as we pointed out in last week’s article, more data, more narrative, doesn’t necessarily translate into higher accuracy. It’s just tracking how good the story is rather than how likely it is. Brains love stories, but hate mathematics and probability. Mine does, anyway.
Which is awkward, because a good story is the main product the finance industry sells. Nobody publishes a research note that says “we have no idea”. They publish a narrative with five moving parts and a price target on the end of it, and the more work they’ve put in, the longer the chain gets. Why? Because they know our brains love stories. For a hundred thousand years, humans sat around campfires telling each other stories. They didn’t talk about maths.
So, the checklist.
Most of what the checklist asks about has already happened. PROPCAF is the price divided by operating cash flow the company has already banked. Net equity, the P/E history, the financial health rating, the audit opinion, the buybacks: all of it comes out of statements that have already been filed. Even the trend lines are drawn through peaks that have already happened, and the only question we ever ask of them is whether a stock has breached a line today.
There are forecast-driven columns in there too. Next year’s consensus EPS feeds the growth score and one of the two intrinsic value calculations. So it isn’t a forecast-free system. But we don’t make the forecast. We borrow one. Tony put consensus numbers into the checklist for an unflattering reason: he tested them against his own IV calculations and found the consensus was better at forecasting where share prices went than he was (see QAV #521). He calls the whole cluster a radar map of value, because no single method gets it right. It’s one estimate, in one place, in a fixed formula, never chained to another estimate. And when no broker covers the stock, those columns just go blank and the rest of the checklist carries on without them. Tony reckons that’s a bonus, because it means we’re in before the analysts start recommending it to their clients.
That’s the QAV difference. We listen to what people are saying, but we also look at the cold, hard numbers. Then we make a heat map.
Anyway. The practical version of chapter 12 takes about four seconds. Next time somebody gives you the case for a stock, or crypto, or gold — count the ANDs. “If this happens AND then that happens, AND…”. Every “and” in that sentence is a multiplication sign. Four of them, at generous odds, puts you at one in four. Six puts you under one in eight. And that’s before you allow for having guessed the individual probabilities too high in the first place, which is what Heuer spends the rest of the chapter demonstrating.
Count the ANDs.

QAV Myth Killers is a weekly column in the QAV newsletter, taking apart a piece of
investing conventional wisdom. Read the series, or
get it by email every Friday.
General advice only. Spacecraft Publishing Pty Ltd
trading as QAV is a Corporate Authorised Representative (CAR 001292718) of MF & Co.
Asset Management Pty Ltd (AFSL 520442). This is general information and does not take your
personal circumstances into account. See our
disclosure.