Hi folks,
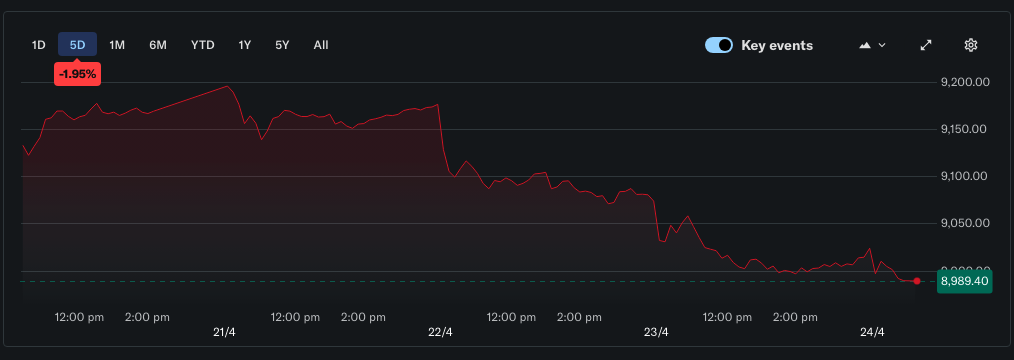
The All Ordinaries dropped over the last couple of days, falling from around 9,150 to close at 9,024.20. Maybe the market is slowly waking up to the reality that requires higher “bad debt buffers” as Tony discussed on this week’s show.
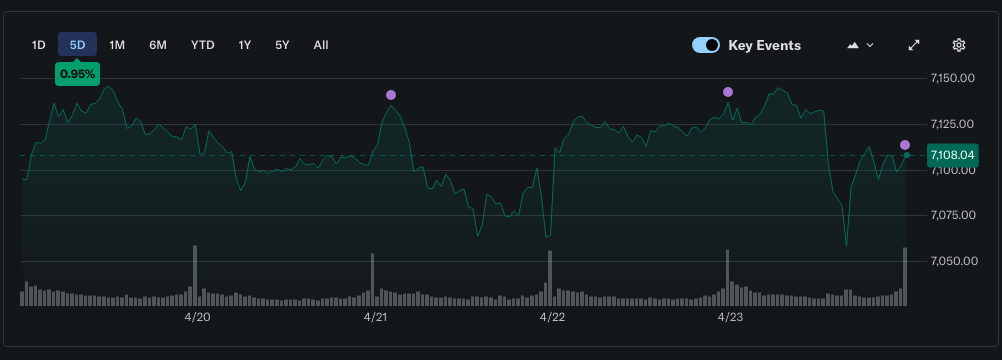
The S&P 500 on the other hand extended its rally over the past five trading days. The index maintained its upward trajectory near record levels, seemingly blissfully unaware of what lies ahead. Ostriches with heads in the sand.
So, let’s get into my weekly updates and see where we are at.
All the Best,
Cam
QAV MYTH KILLERS
“Bricks and Mortar Always Win” — But Do They?
Australians have a near-spiritual belief in property. It’s practically encoded in the national DNA. Bricks and mortar. Safe as houses. You can’t go wrong with real estate.
And look, they’re not entirely wrong. Sydney and Melbourne property has delivered stunning returns over the past 30 years. A house bought in Paddington in 1990 for $400K is worth $4M+ now. Hard to argue with that.
But the myth almost always conflates leverage with returns. Most people buy property with an 80% mortgage. If a $500K house rises to $600K, that’s a 100% return on a $100K deposit — not a 20% return. Shares rarely get compared on a leveraged basis. When you strip out the debt and compare asset-to-asset performance, the story changes.
Even the Federal Reserve Bank of San Francisco noticed. In a landmark 2015 paper “The Rate of Return on Everything”, they analysed nearly 150 years of data across asset classes. Looking at the full dataset, Australian real estate returned 6.37% per annum in real terms, against 7.81% for stocks. Zoom in on the period from 1980 onwards, the era most relevant to today’s investors, and it’s not even close: stocks returned 8.78% per annum against property’s 7.16%.
And that’s before you account for the costs property investors prefer not to think about.
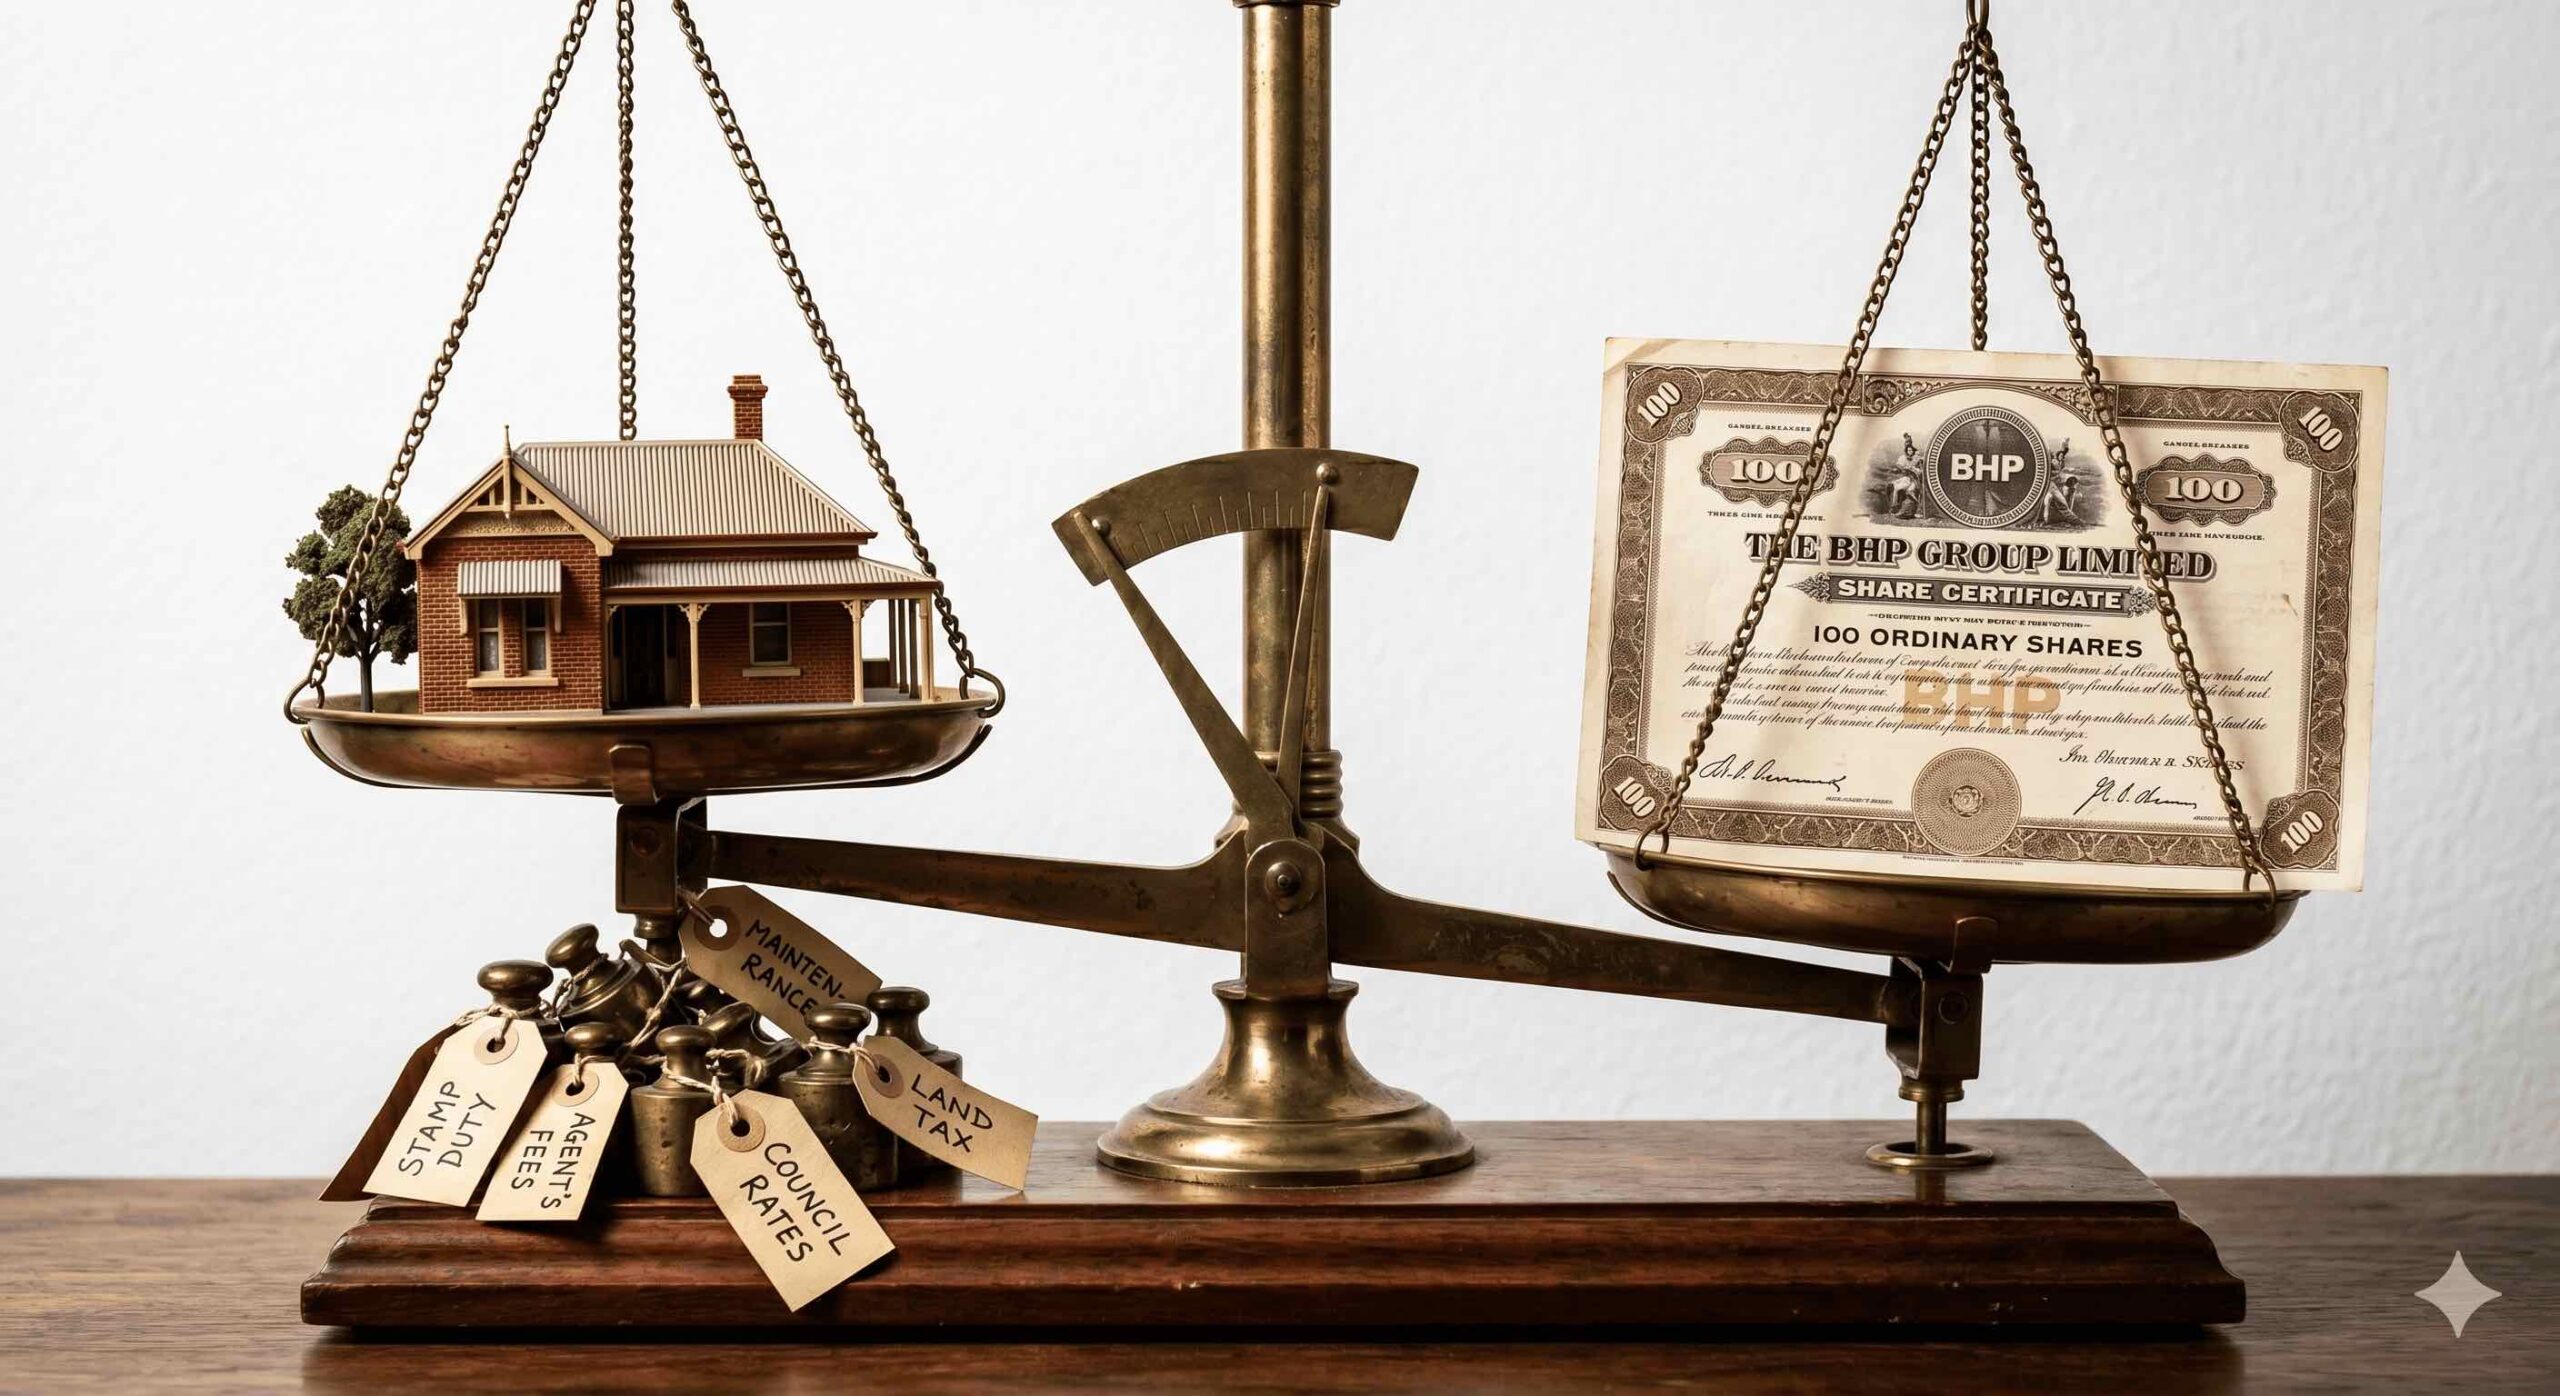
Stamp duty on a $1M property purchase in NSW runs to around $40,000. That’s 4% you need to earn back before you’ve made a cent. Add agent commissions on sale (around 2–2.5%), annual holding costs for rates, insurance, maintenance and property management (typically 1–1.5% of property value per year), and the real return shrinks considerably. Compare that to a $10 brokerage fee on a $10,000 share purchase (0.1%) and you start to see how skewed the comparison has always been.
None of this is to rain on real estate’s parade entirely. Tony often talks about how he leveraged into property after the GFC to turbocharge his stock portfolio. Used strategically, it can work. But it’s a tool, not a religion.
Liquidity is another thing property investors tend to wave away. Tony’s been trying to sell his sky palace apartment in Sydney for a couple of years and can’t find the right buyer. Outside of a major correction, he could offload $10 million in stocks in 24 hours.
For my money, though, there’s one difference that almost never gets mentioned in these property-versus-shares debates: you can vastly outperform average returns if you’re an intelligent, disciplined investor in stocks. You can’t outperform the Sydney property market by being smarter about Sydney property. You’re just along for the ride.
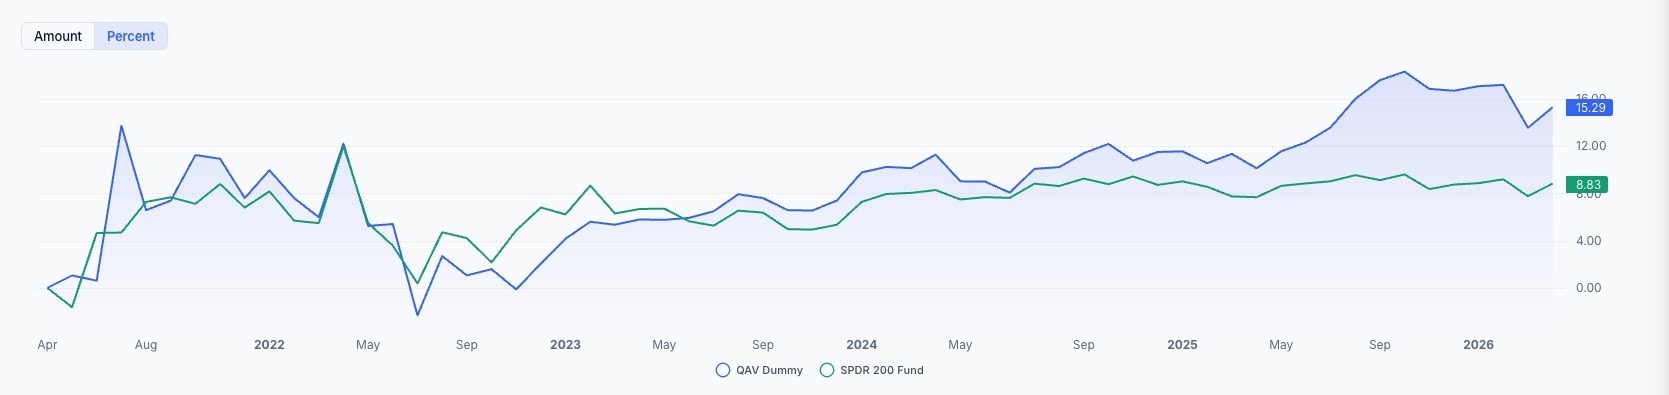
QAV’s dummy portfolio has returned roughly 15% per annum over the past 5 years against an ASX 200 benchmark of 8% — roughly double market. Tony’s been achieving that kind of result for 30 years, using a checklist that asks hard quantitative questions property investors almost never apply to their own portfolios.
The QAV checklist doesn’t ask “is this a nice suburb?” It asks whether a business is genuinely profitable, whether the price is right, and whether the numbers justify the risk. That’s it. No stamp duty. No tradies. No tenants.
Property made a generation of Australians wealthy. But it did it on borrowed money and borrowed time. A system that compounds quality returns, reinvests dividends, and doesn’t charge you stamp duty doesn’t need a narrative. It just needs to keep running.

STOCK ANALYSIS OF THE WEEK
I added one stock to the Light portfolios this week and you can see my Light posts here.
I also added something to the U.S. Light portfolio this week. U.S. Light and Club members can read about it here.
On the full Australian podcast this week, Tony did a deep dive on CCL. See the podcast link down below if you want to listen to his analysis.
BUY LIST
Each week, we produce a buy list based on our value investing system that we share with our QAV Club members. The intended primary purpose of this buy list is for club members to use as a reference for comparing their own buy list. In theory, all of our buy lists should look pretty similar each week.
QAV Value Investing Buy List (AU) 2026-04-18
Below is a link to the US list for this week (available exclusively to our U.S. Club members):
QAV Value Investing Buy List 2026-04-19
PORTFOLIOS
We compare our performance to what we think is the most relevant benchmark (SPDR 200 in Australia, S&P500 in the USA), but if you’re new to investing, these comparisons might not mean much. Instead, you can compare our performance to the top-performing Super Funds in Australia and see why an amateur active investor (who has a system to follow) can out-perform most of the “professionals”.
AUSTRALIAN
QAV DUMMY
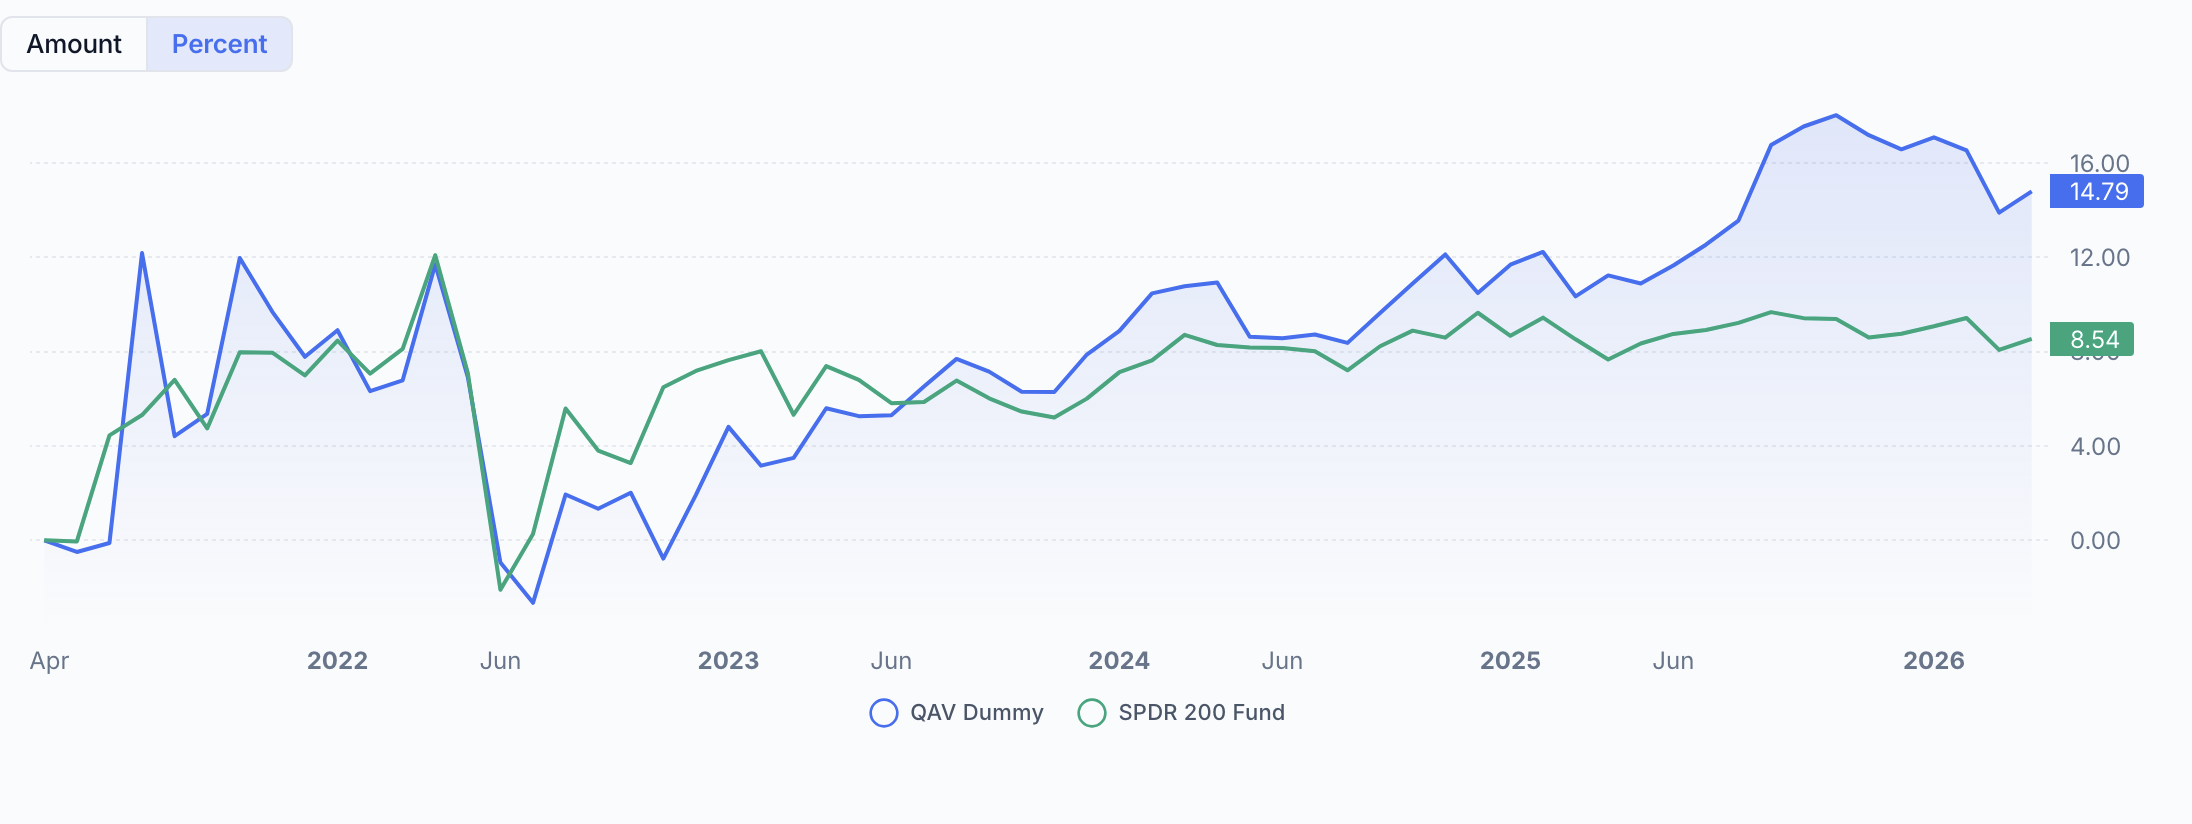
Five Year Report: Over the last 5 years, the QAV AU portfolio delivered a return of approximately 14.79% per annum, while the ASX 200 benchmark returned around 8.54%.
Monthly Report: Over the past 30 days, the QAV AU portfolio delivered a return of approximately 3.9%, while the ASX 200 benchmark returned around 3.0%.
No changes to our portfolio this week.
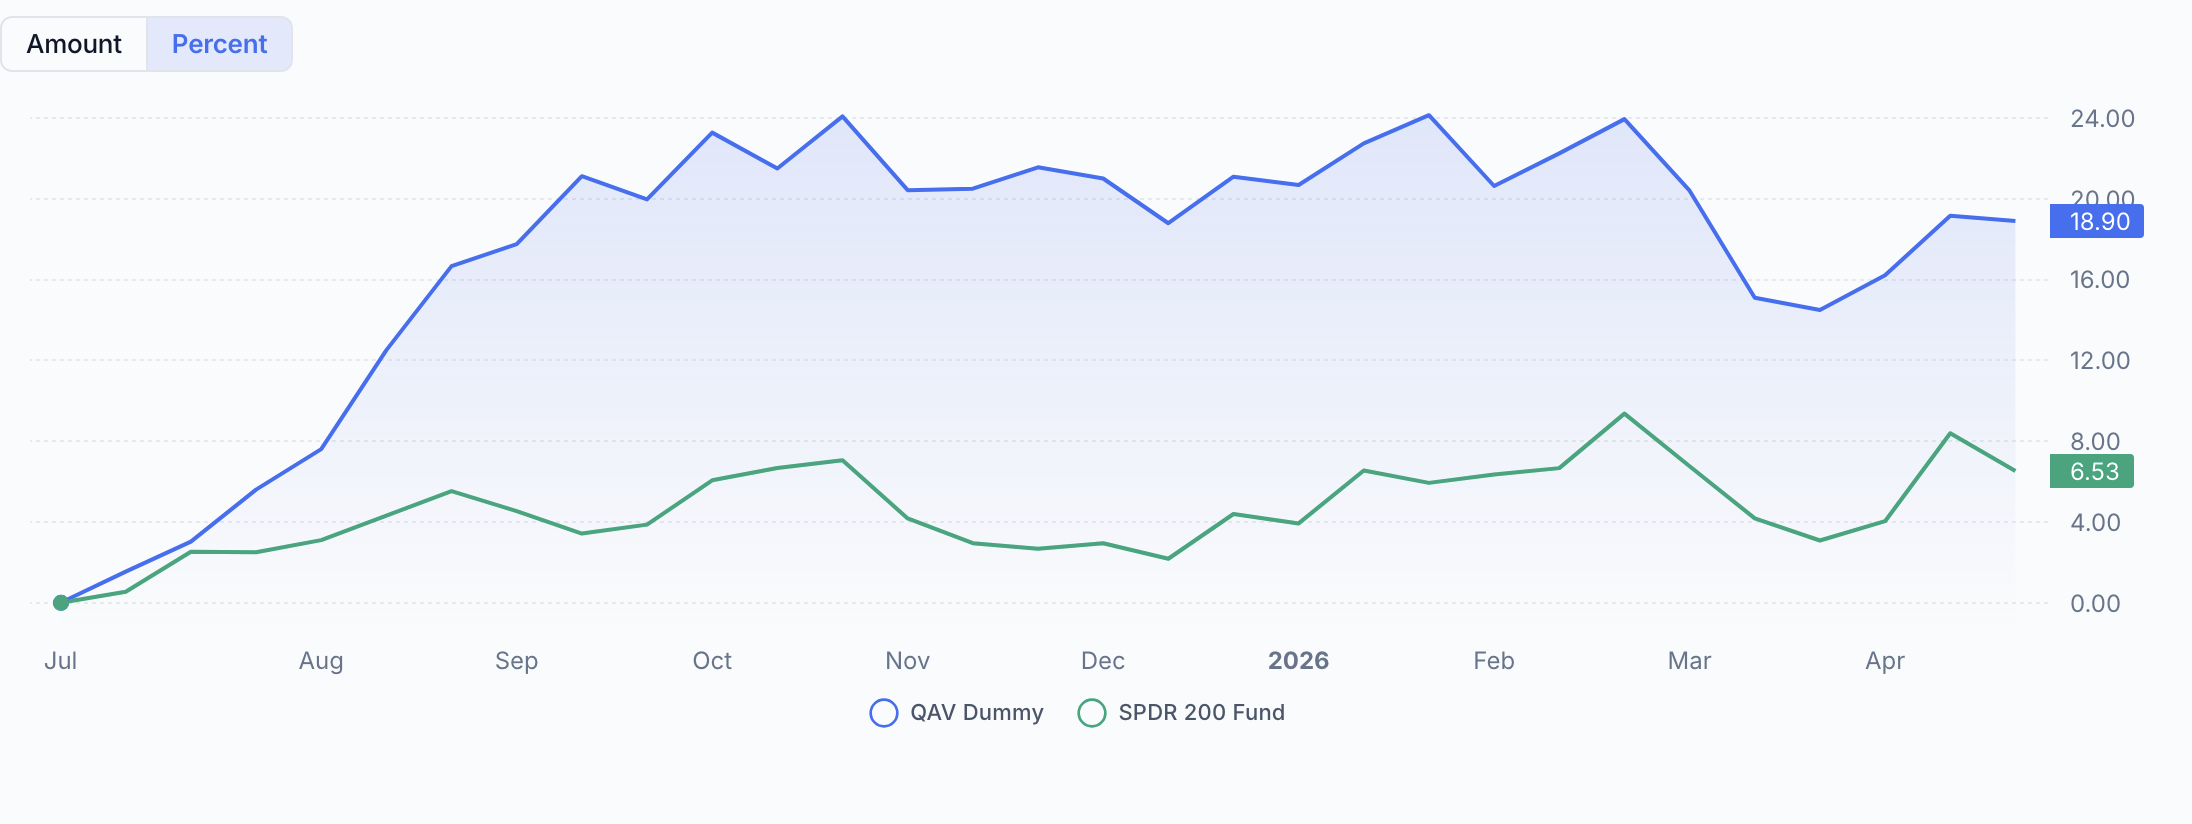
For FY26: Over the financial year to date, the QAV AU portfolio generated a return of approximately 18.9%, while the ASX 200 benchmark returned around 6.5%. TRIPLE MARKET.
QAV LIGHT
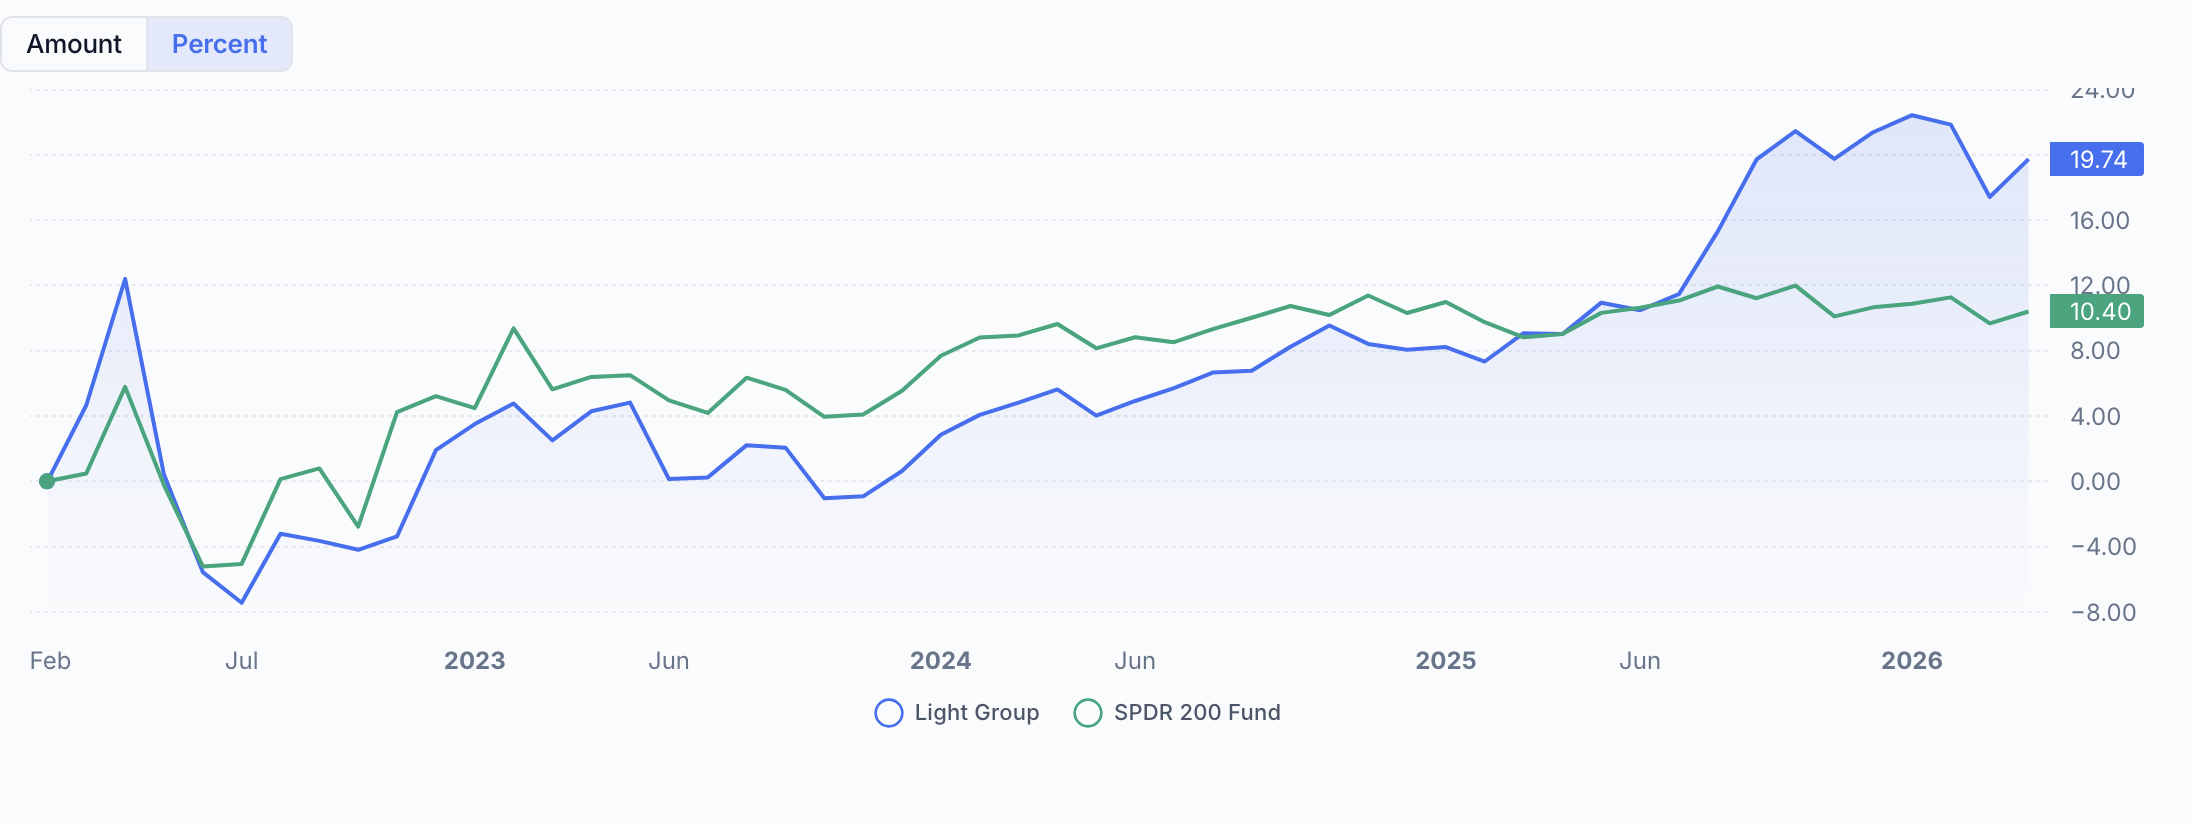
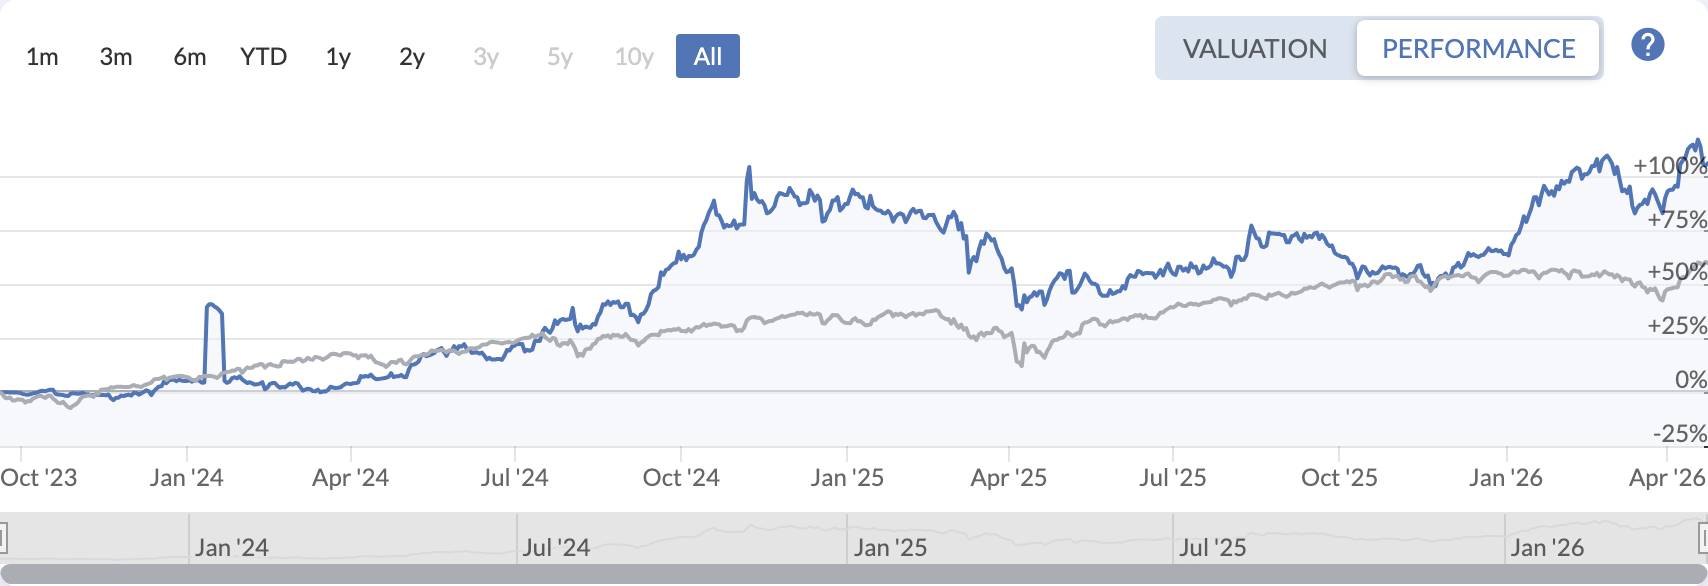
All Time
Over the All Time period, the QAV AU Light portfolio delivered a return of approximately 19.7%, while the ASX 200 benchmark returned around 10.4%.
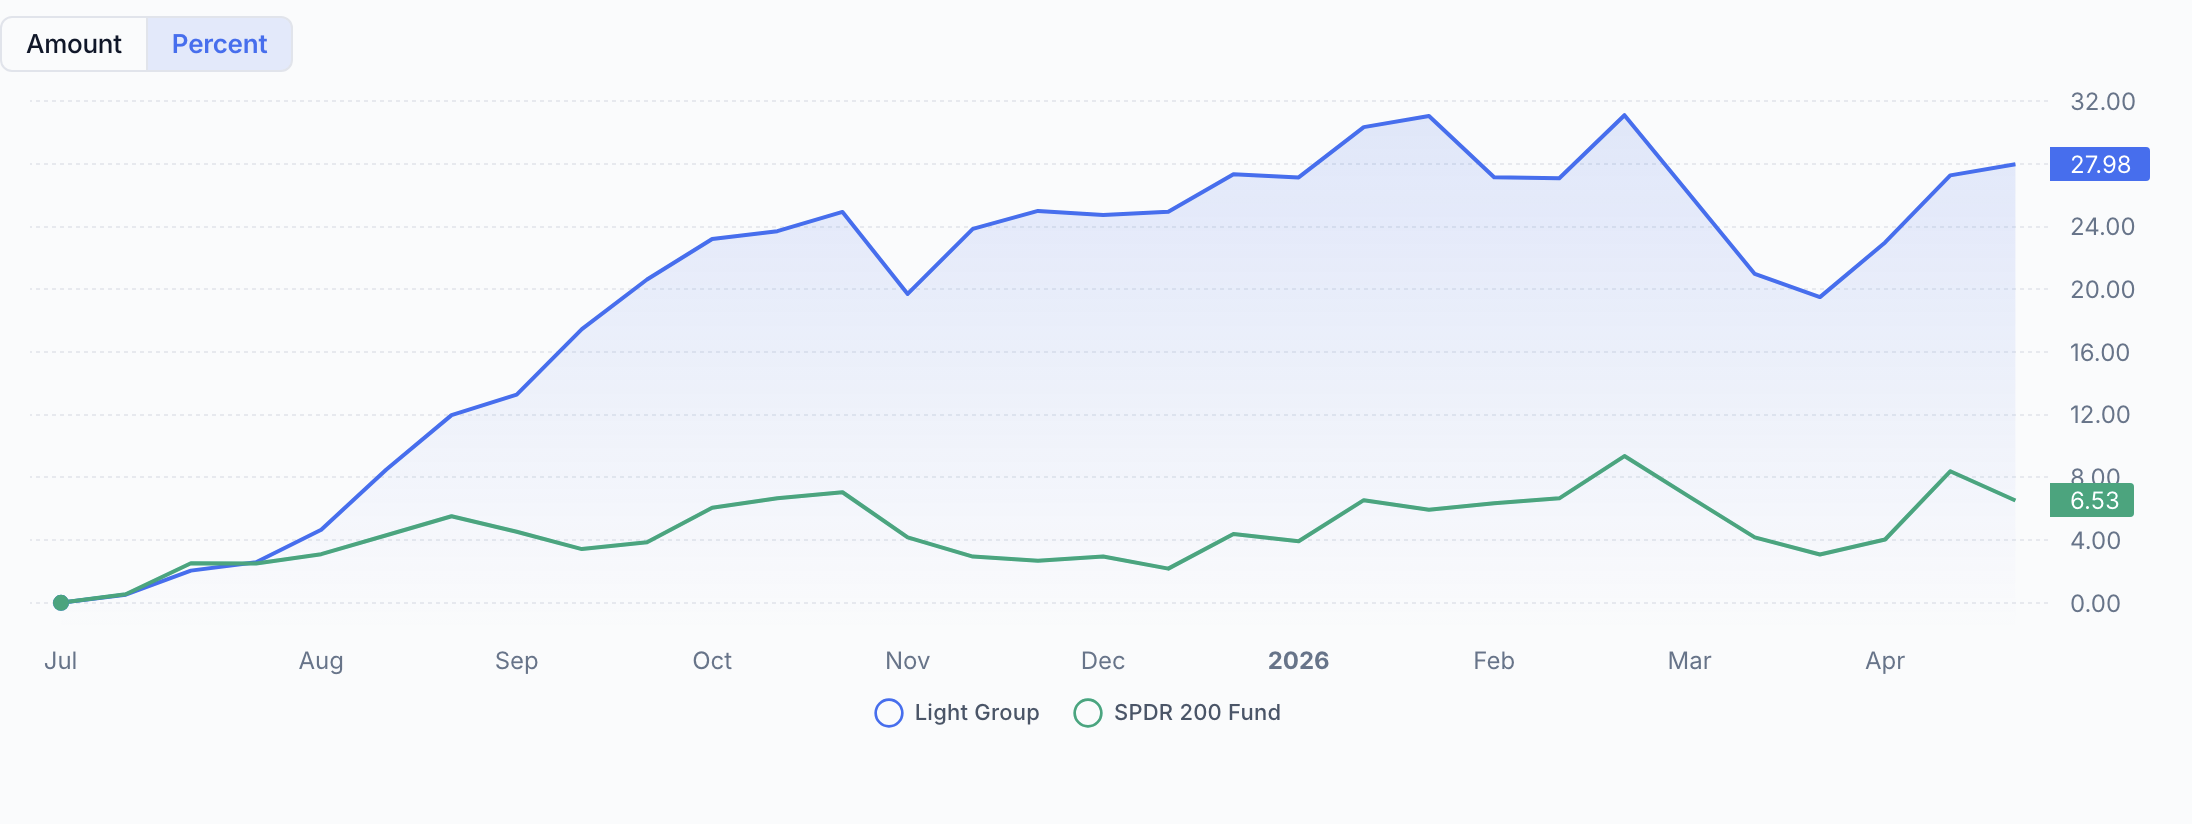
Financial Year to Date — QUADRUPLE MARKET.
Over the financial year to date, the QAV AU Light portfolio delivered a return of approximately 27.98%, while the ASX 200 benchmark gained around 6.53%.
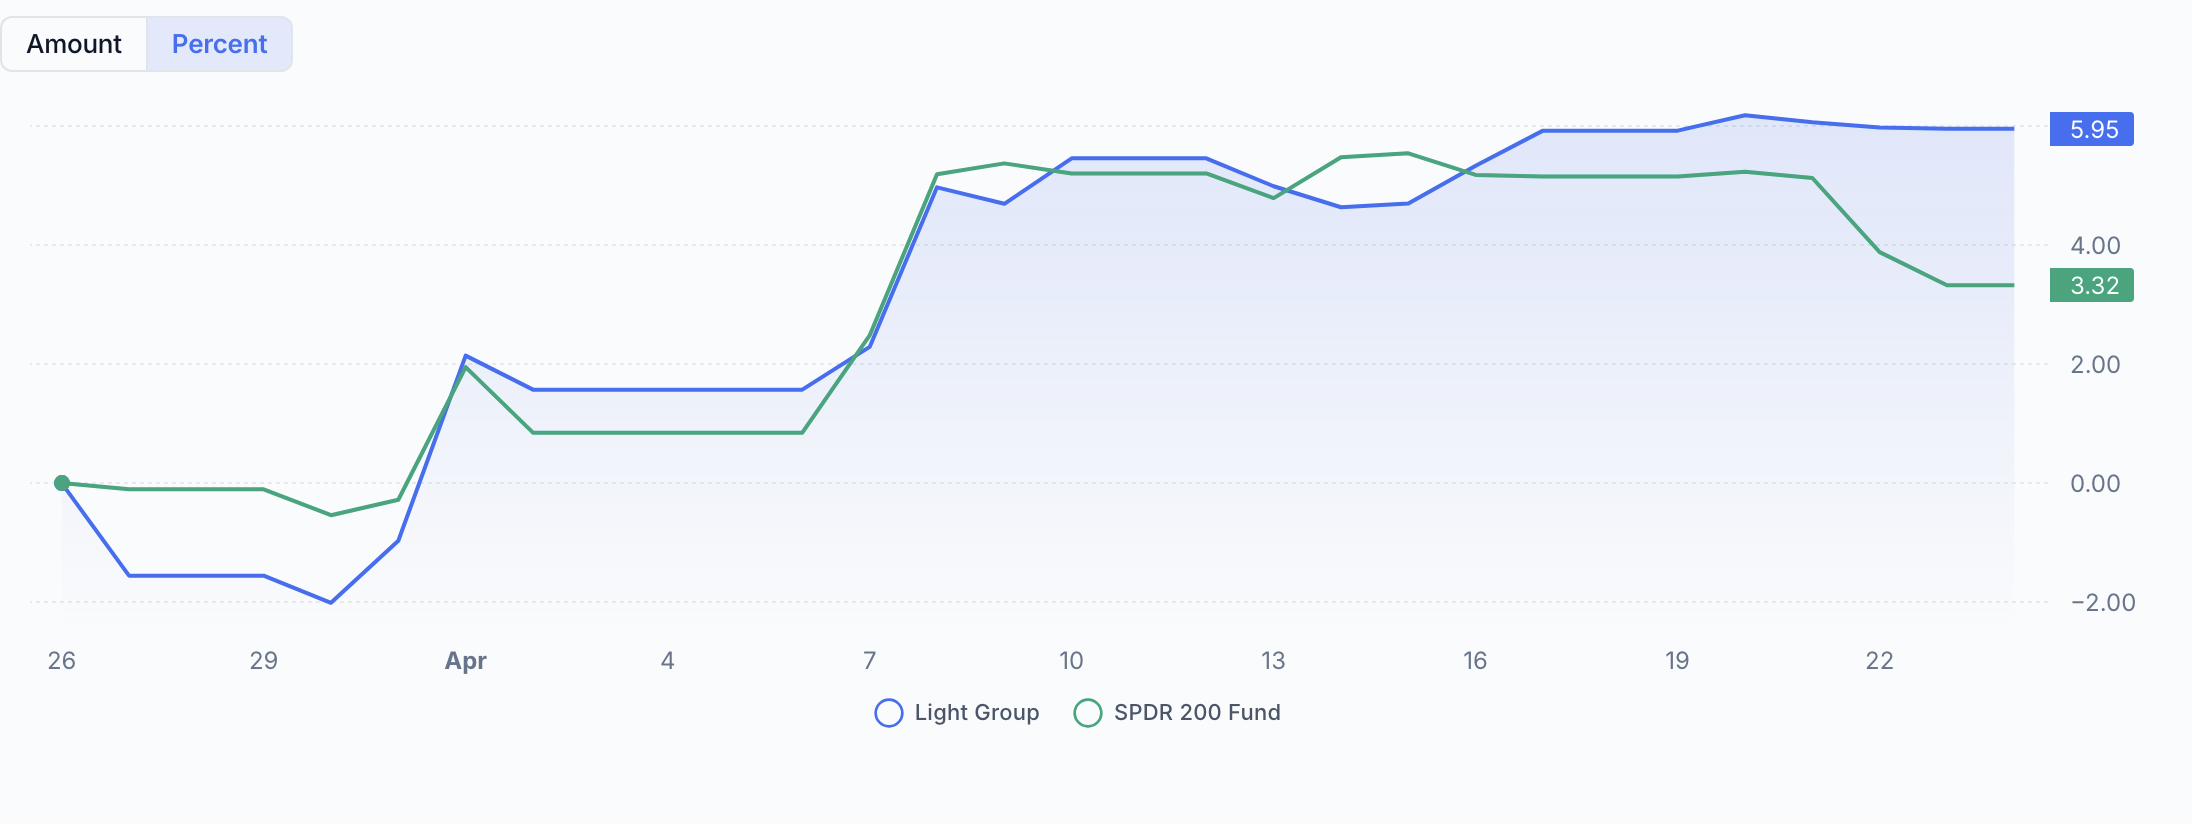
Last 30 Days
Over the past 30 days, the QAV AU Light portfolio delivered a return of approximately 5.95%, while the ASX 200 benchmark gained around 3.32%.
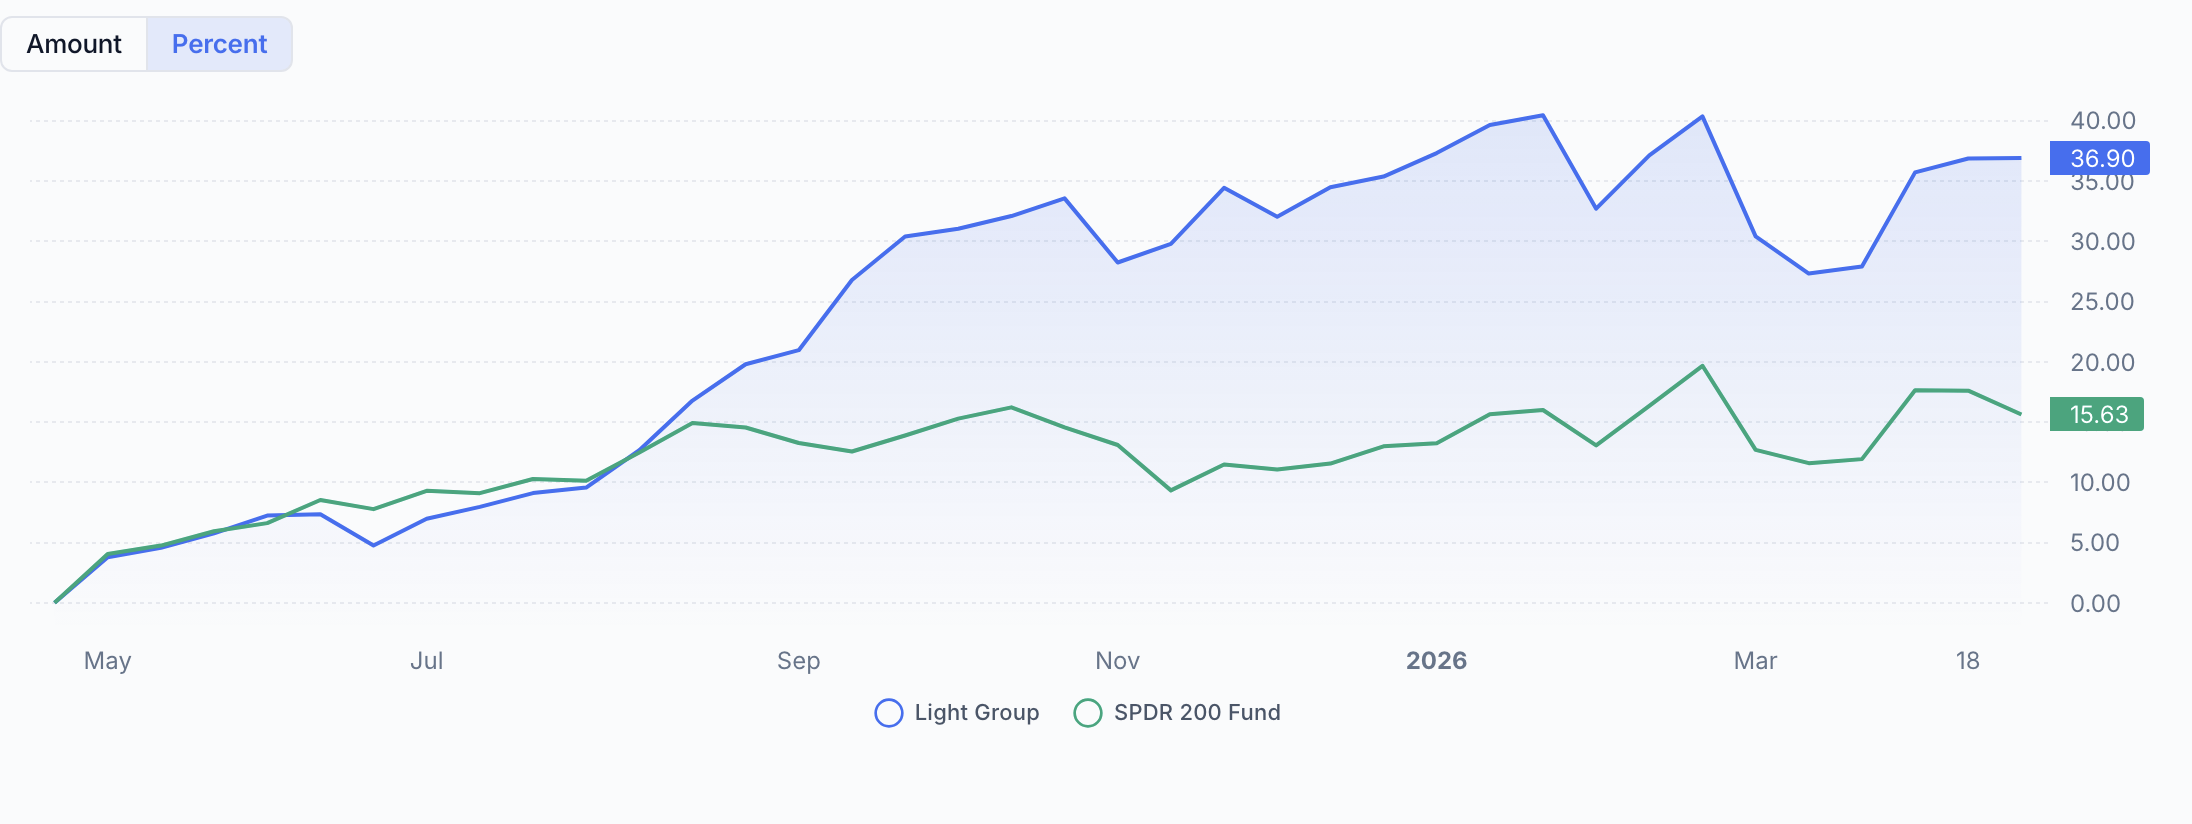
Last 12 Months
Over the last 12 months, the QAV AU Light portfolio delivered a return of approximately 36.9%, while the ASX 200 benchmark returned around 15.6%.
Become a QAV Light Member today and start your investing on the right track
If you want to find out what we’re trading in QAV Light each week, sign up to become a member. You’ll get an email from me every Monday letting you know what we’re buying and selling in that portfolio. You can choose to copy our trades or not. It’s the easiest way to start your rules-based investing career… and you don’t even need to know the rules. I’ll follow the rules for you. It’s a good first step to eventually becoming a QAV Club member and learning how to run the system by yourself.
QAV LIGHT: You don’t have to build it yourself.

(Note: Americans interested in joining QAV Light or Club please go here instead.)
AMERICAN
QAV DUMMY
The QAV America portfolio has delivered returns of +107% since inception, significantly outperforming the S&P 500 benchmark which gained +60% over the same period.
Over the past 30 days, the QAV America portfolio delivered a +8% return compared to the S&P 500’s flat performance near 7%.
No trades this week.
QAV LIGHT
Since inception (Dec 2025), our portfolio is +8% vs the S&P 500 +3%. Over the last 30 days our portfolio is +8% vs the S&P 500 +8%.
THIS WEEK’S EPISODES

Subprime Time: Lending to America’s Underbanked at 36% APR – QAV America #49
STOCK NEWS AND UPDATES
COMMODITIES
This week the big changes to commodities were the following:
| Commodity | Status |
|---|---|
| Magnesium | JOSEPHINE |
| Steel | JOSEPHINE |
| Iron & Steel Scrap | SELL |
| Lithium | BUY |
DISCLOSURE
Please review our trading and disclosure policy.
SIGNING OFF
Hope you found this week’s deep dive into CCL insightful – sometimes the best opportunities are hiding in plain sight right in our own backyard. Remember, we’re not trying to time the market perfectly, we’re just following our checklist and letting the numbers guide us to quality companies at reasonable prices. Stay disciplined, stick to the process, and keep building that portfolio one stock at a time.
SSDD!
- Cam
That’s it for the week!
QAV A GOOD SHAREMARKET!
Got a question? [email protected]