
This week I don’t really have a “myth killer”. It’s more of a “why is it so” Professor Julius Sumner Miller article.
On a recent episode, Tony made the argument that double market may be close to the practical frontier for sustained, scalable, long-term investment performance. It’s something I’d never really thought about before. Why does QAV return double market? Why not triple or quadruple market? Why has Buffett achieved double market over his long career?
Is double market the speed of light for long-term investing?
And another question — how likely is it that 25 years of just crazy luck would produce an average return of double market?
On the show, Tony tried to explain this theory but I couldn’t really follow it. Statistics was never my strong suit. In fact, I’m not sure I actually have a strong suit. Or a suit, for that matter. I haven’t had a real job in over twenty years. But that’s another story. So I spent some time with ChatGPT trying to get my head around it. WARNING: Some maths follows. But I’ve tried to explain it as simply as I can and I think it’s worth the effort to understand. You’ll at least have a good story to tell at your next dinner party.
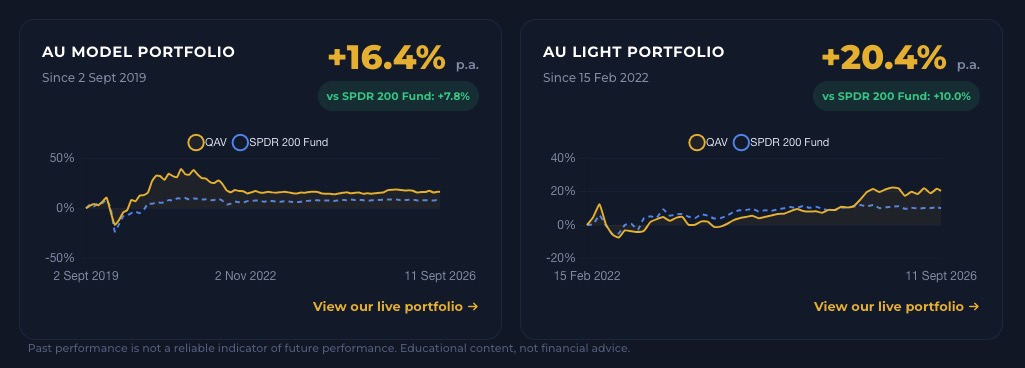
I’m going to preface all of this by pointing out that, while I’ll be talking about 20% returns, that’s based on an average market return of 10% per annum. In QAV, we talk about “double market”, which would mean 20% if the market constantly achieved an average of 10% per annum, but, of course, while that is true over the long-long-term, in any smaller timeframe, it varies. Tony himself has been getting roughly double market for 30 years. The QAV portfolios are much younger, but so far they’re doing roughly the same thing. For example: As of the time I’m writing this, our QAV AU MODEL PORTFOLIO has returned +16.4% p.a. since 2 Sept 2019, versus the SPDR 200 FUND +7.8%. Our QAV AU LIGHT PORTFOLIO (inception 15 Feb 2022) has returned +20.4% versus the SPDR 200 +10%. Different timeframes, different results, but both roughly double market.
Okay, disclaimer out of the way.
Australian shares have historically returned roughly 10% to 11% a year including dividends, while individual annual returns have varied enormously. For example, including dividends, the market fell 40.4% in 2008 and rose 39.6% in 2009.
Those two years show how wildly a single year can vary from the long-term average. But as more years are averaged together, unusually good and bad years tend to offset one another, making the long-term average much less erratic.
To measure that effect, we need one statistical idea: standard deviation. This is simply a measure of how widely the results are spread around the average. For annual market returns, we’ll use a rounded figure of 15 percentage points.
The market doesn’t arrange itself into a perfect bell curve. But if we want to estimate the chances of 25 years of dumb luck producing a 20% average, we need a simple mathematical version of the market to test it against. So, for this exercise, imagine those annual returns arranged in a bell curve centred on 10%.
About 68% of individual years would fall between −5% and +25%.
About 95% fall between ‑20% and +40%, leaving only 5% outside that wider range.
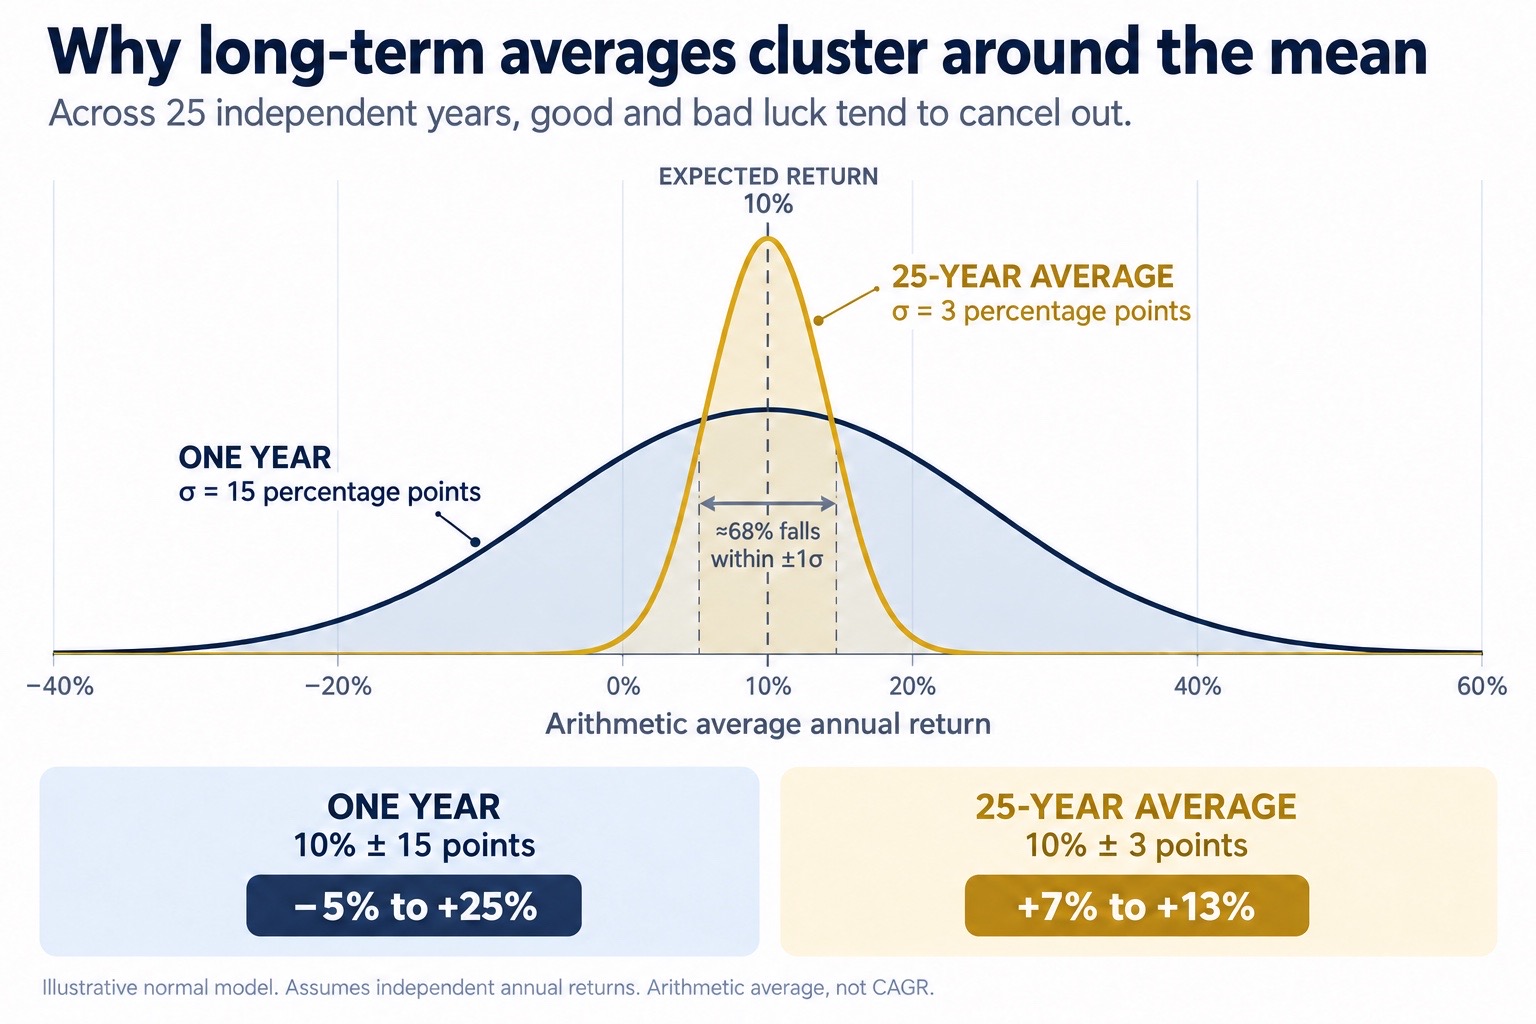
If you average the 25 years together, you find that the good and bad years tend to cancel one another. So the 25-year average is much less erratic than any single year.
There’s a formula to work out how widely those 25-year averages would vary: the standard deviation of the annual returns, divided by the square root of the number of years.
15% ÷ √25 = 15% ÷ 5 = 3%
That 3% is called the “standard deviation of the 25-year arithmetic average”.
So a 25-year average of 7% would be one standard deviation below the expected result of 10% (ie 10–3).
A 13% average would be one standard deviation above (ie 10 + 3). A 16% return would be two, and a 19% return would be three.
A 20% average would be 3.33 standard deviations above. And that, as it turns out is very hard to achieve.
A single year returning 20% is completely ordinary. A 25-year average of 20% is extraordinary.
Here’s the important thing about the far end of a bell curve: it doesn’t gently slope away. As you can see in the chart — after 20%, it falls off a cliff.
Under this simplified model:
- A 20% arithmetic average is 3.33 standard deviations above expectations: approximately 1 chance in 2,300. Pretty hard.
- A 22% average is four standard deviations above: approximately 1 chance in 31,000!
- A 25% average is five standard deviations above: approximately 1 chance in 3.5 million!
- A 30% average, or triple market, is 6.67 standard deviations above: approximately 1 chance in 76 billion!
Now I’m not saying that 1 in 76 billion isn’t POSSIBLE… but it’s definitely like the chances of finding a politician with integrity. Or, as Sir Humphrey put it: ‘Ministers,’ he said, ‘have a whole range of dazzling qualities including … um… well, including an enviable intellectual suppleness and moral manoeuvrability.’
But wait! There’s more!
A 20% return as an average isn’t the same as a double market return CAGR.
That is even harder to achieve.
For example, let’s say you invested $100 and had a return in Year One of +50% and then a return in Year Two of −10%. You’d have an arithmetic average of 20% ((50 − 10) ÷ 2 = 20%)
But CAGR asks:
What constant return in both years would turn $100 into $135?
A CAGR result would look at the final value of the portfolio. At the end of the first year your $100 becomes $150 (100 x 1.5), but in Year Two it drops to $135 (150 x .9). The CAGR calculation is (ending value ÷ starting value)^(1 ÷ years) − 1
Which comes out as only 16.2% — less than 20% or double market, if you use the 10% p.a. average.
QAV (and by that I mean Tony) has achieved roughly double-market CAGR over its history so far. So that’s really something.
Now — new players might think “meh, 10%, 20%, big deal”. Does that extra 10% really account for much?
Yes. Yes it does. And probably more than you think.
At 20% versus 10% for 25 years, the investor does not finish with twice the market’s wealth. They finish with about 8.8 times as much. That’s the magic of COMPOUNDING.
Back to Buffett. Berkshire’s newly published 1965–2025 record is 19.7% annually against 10.5% for the S&P 500. The overall gains were 6,099,294% versus 46,061%. That is roughly 132 times the ending wealth, despite the annual return being slightly less than double.
Does this prove that double market is a physical speed limit? No.
What it tells us that a double market return over decades is probably not dumb luck.
And it does explain why double market starts to resemble a practical frontier (QAV — THE PRACTICAL FRONTIER, coming to a movie screen near you this summer).
To beat the market for a year is unremarkable. To beat it for 25 years requires a persistent edge. To return twice the market for 25 years requires an edge that is not only enormous and persistent, but also survives changing markets and multiple boom and bust cycles.
So double market may not be exactly like the speed of light. But I think it’s a pretty good analogy. Physics tells us nothing can go faster than the speed of light. The maths tells us that beating double market over decades isn’t impossible. It’s just extremely unlikely.

QAV Myth Killers is a weekly column in the QAV newsletter, taking apart a piece of
investing conventional wisdom. Read the series, or
get it by email every Friday.
General advice only. Spacecraft Publishing Pty Ltd
trading as QAV is a Corporate Authorised Representative (CAR 001292718) of MF & Co.
Asset Management Pty Ltd (AFSL 520442). This is general information and does not take your
personal circumstances into account. See our
disclosure.
Leave a Reply