Morgan Housel has a blog post called “100 Little Ideas”. It’s a list of concepts from different fields that help explain how the world works, and number 52 on the list is ‘Feedback Loops’.
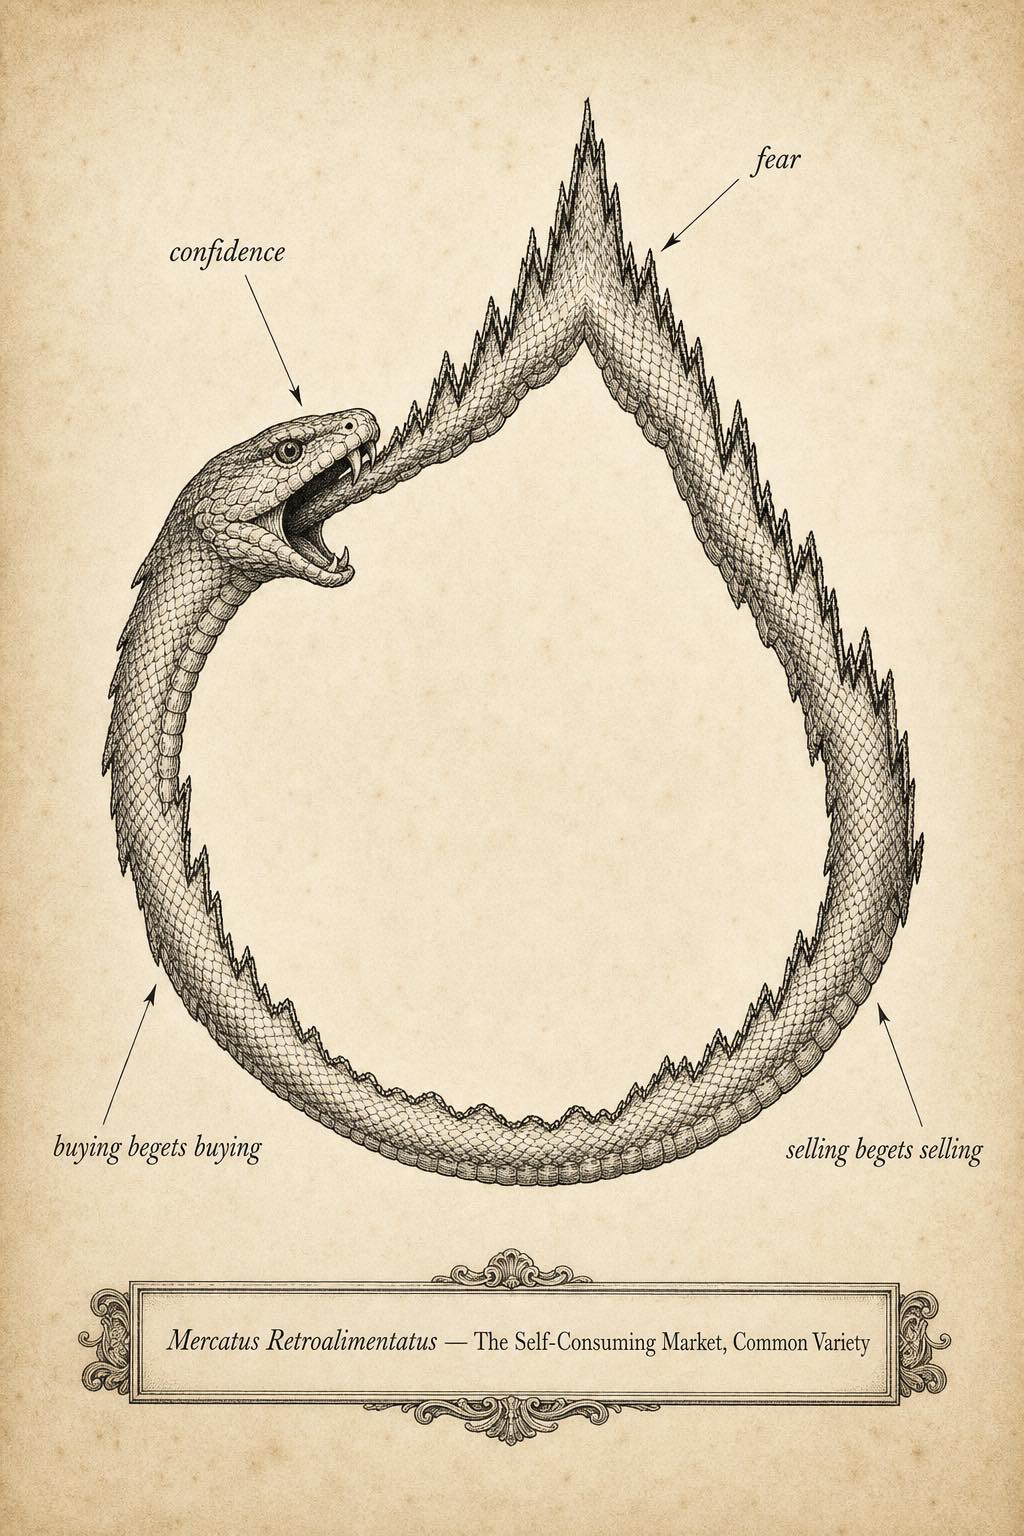
“Falling stock prices scare people, which cause them to sell, which makes prices fall, which scares more people, which causes more people to sell, and so on. Works both ways.”
We capture this in QAV with our three-point trend lines. The checklist might turn up a company with terrific looking numbers, but if the chart is heading in the wrong direction, there’s not much sense buying into it until it turns around. We could get killed by a negative feedback loop.
You’ll hear people say that markets are rational because everything is known and priced in. The flaw in that theory is that markets are made of humans.… and humans aren’t rational. If I was rational, I wouldn’t be making history podcasts for a living. I’d get a real job.
Daniel Kahneman put it about as plainly as it can be put in Thinking, Fast and Slow. Every time a share changes hands, one person is buying and another is selling, at the same price, on the same day, with the same public information sitting in front of both of them. Both can’t be right.

“The puzzle is why buyers and sellers alike think that the current price is wrong. What makes them believe they know more about what the price should be than the market does? For most of them, that belief is an illusion.”
I guess both can be rational, making the best decision they can based on the data they have and their operating thesis for the stock. But they obviously think they know better than the market. As do we — so does that make us irrational? Or just more confident in our model?
You might think amateurs panic and the professionals sit there confidently hoovering up whatever the amateurs dump… but I debunked the value of confidence in a recent article.
A few weeks ago I wrote about Richards Heuer’s Psychology of Intelligence Analysis and those eight horserace handicappers who were given more and more data about each race. Their accuracy didn’t move. Their confidence climbed the whole way. On five pieces of information their confidence was roughly calibrated to how well they were actually doing. By forty they were badly overconfident. The clinical psychologists did the same thing, and so did the doctors. Being a professional doesn’t exempt you from that. More screens and more data buy you conviction rather than accuracy, and conviction is the fuel a feedback loop runs on. You might look busy. You might feel busy. But you’re still wrong.
Our three point trend lines also leverage the upside of positive feedback loops. There’s a well-known paper from the Journal of Finance in 1990 arguing that, when enough people are trading on price direction rather than value, the rational move for a sophisticated investor is to get in front of them, buy early and ride it. That’s why our checklist gives an extra point if there’s a new three point upturn. Of course, we’re only buying a stock if it stacks up well enough on other metrics to have a strong QAV score, we’re not just trading on sentiment alone.
The cleanest demonstration of the power of feedback loops is crypto, which we have talked about a lot on the show. Our fundamental issue is that no-one can tell you what a single Bitcoin is worth. There’s no cash flow to discount, no assets to count, no earnings to multiply. There is no rational model available for working out whether today’s price sits above or below intrinsic value, because there’s nothing to model.
And yet the price moves violently, up, down, based purely on feedback loops, nothing else.
It works at the level of an entire market, too. On the 19th of October 1987 the Dow fell 508 points in a single session, 22.6%. The Federal Reserve’s own history of the crash describes the mechanism in one sentence: “An initial price decline starts a vicious circle by causing portfolio insurers to sell, causing further price declines, causing portfolio insurers to sell again, and so on.” The official inquiry, the Brady Report, called it “a self-reinforcing contagion of fear”.
We see it happen on a smaller scale all of the time when a stock goes ex-dividend. The price will drop as people who were holding out for the dividend sell their holdings. But then the price continues to drop, well below the value of the dividend. Why? Feedback loops. The price is falling so people (and algorithms) sell. It’s easy for an investor to get caught up in the emotion and the panic.
Which is why our trend lines exist.
The checklist tells us if a business contains a good balance of quality and value. It has nothing to say about what several thousand other people are going to do with the share price over the next few months. Some of them are selling because the chart looks bad. Some of them are buying because the chart looks good. Whether that’s rational or not doesn’t much matter, because they both affect our investment.
The trend lines recognise groupthink, but they also allow for the possibility that a stock falling despite good numbers on paper might be falling for perfectly rational reasons that we’re simply not aware of, because we’re not experts in that company or its sector or what its competitors are up to.
And we don’t want to be experts. We don’t have to be. We’re experts at using the system. That, as it turns out, is enough.
The sell line tells us the market has turned pessimistic on a stock, rightly or wrongly. The buy line tells us there’s enough support behind it that the market isn’t rejecting the thesis. Neither one is a forecast. They’re a reading of where things stand today.
Works both ways.
QAV Myth Killers is a weekly column in the QAV newsletter, taking apart a piece of
investing conventional wisdom. Read the series, or
get it by email every Friday.
General advice only. Spacecraft Publishing Pty Ltd
trading as QAV is a Corporate Authorised Representative (CAR 001292718) of MF & Co.
Asset Management Pty Ltd (AFSL 520442). This is general information and does not take your
personal circumstances into account. See our
disclosure.
Leave a Reply